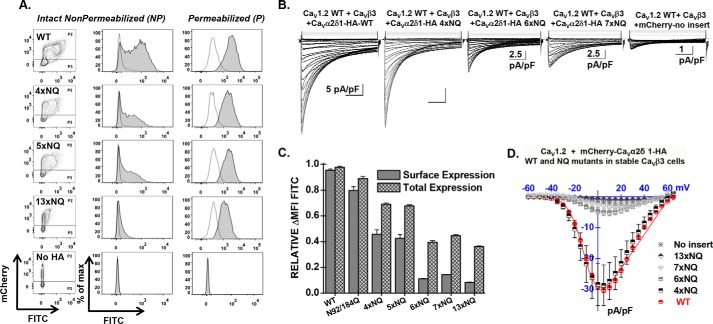
FIGURE 3.
Simultaneous mutations of six N-glycosylation sites disrupt cell surface expression of CaVα2δ1 and prevent the stimulation of CaV1.2 currents. Stable CaVβ3 cells were transiently transfected simultaneously with pCMV-CaV1.2 WT and pmCherry-CaVα2δ1-HA WT or mutants. A, representative two-dimensional plots of mCherry versus FITC fluorescence are shown for each N-glycosylation mutants (NQ) after the disruption of four sites (4xNQ), five sites (5xNQ), and 13 sites (13xNQ). The No HA construct is mCherry-CaVα2δ1 WT. The distribution of the fluorescence intensity measured for cells within the P2 gate (fluorescence-positive cells) are shown in gray, and the distribution of fluorescence intensity for cells present in the P3 gate (fluorescence-negative cells) is displayed as an overlay in a transparent gray plot. In all cases, the ΔMFI fluorescence measured for FITC in permeabilized cells was qualitatively similar to the constitutive fluorescence measured for mCherry validating the accessibility of the HA epitope and confirming the values obtained for total protein expression. Numerical values are shown in Table 1 and data not shown. B, representative whole-cell Ca2+ current traces obtained after recombinant expression of CaV1.2 in stable CaVβ3 cells with mCherry-CaVα2δ1-HA WT or mCherry-CaVα2δ1-HA glycosylation NQ mutants. The same mCherry-CaVα2δ1-HA constructs were used for the flow cytometry assays and the patch clamp experiments. Currents were recorded in the presence of 2 mm Ca2+ from a holding potential of −100 mV. Time scale is 100 ms throughout. Unless specified otherwise, the current density scale is 5 pA/pF. Co-expression with CaVα2δ1 shifted the voltage dependence of activation of CaV1.2 WT/CaVβ3 from E0.5, act = 8 ± 2 mV (n = 35) (no CaVα2δ1) to E0.5, act = −9.4 ± 0.2 mV (n = 231) (for CaV1.2 WT/CaVβ3 with mCherry-CaVα2δ1-HA WT), a significant −15-mV shift in the activation potential. The free energy of activation (ΔGact) measured in the presence of mCherry-CaVα2δ1-HA WT was well described by a Gaussian distribution centered at −0.86 ± 0.2 kcal mol−1 (n = 231). C, bar graph shows the normalized ΔMFI measured in the presence of FITC in intact (surface expression) or permeabilized cells (total expression) in flow cytometry experiments. D, averaged current-voltage relationships, recorded in the presence of 2 mm Ca2+, are shown for mCherry-CaVα2δ1-HA WT, and the multiple mCherry-CaVα2δ1-HA mutants 4xNQ (N92Q/N348Q/N594Q/N876Q), 6xNQ (N92Q/N184Q/N348Q/N594Q/N812Q/N876Q), 7xNQ (N92Q/N184Q/N348Q/N594Q/N812Q/N876Q/N986Q), 13xNQ (N92Q/N136Q/N184Q/N348Q/N468Q/N585Q/N594Q/N769Q/N812Q/N876Q/N883Q/N986Q/N1066Q). Currents traces obtained with the mCherry vector are also shown. See Tables 1 and 2 for analysis of the statistical significance.

