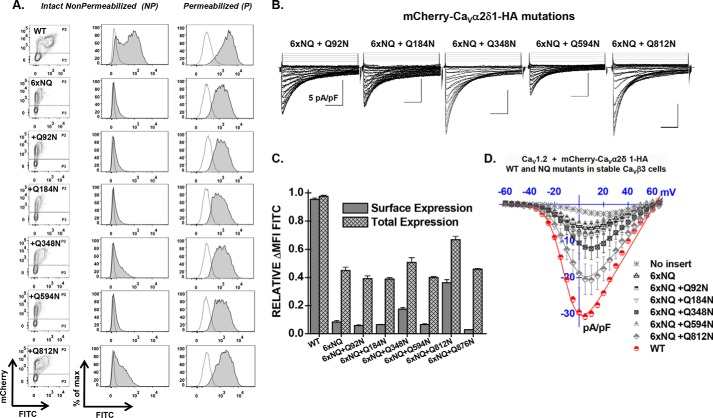
FIGURE 4.
Reverse mutation Q812N cancels the impact of the 6xNQ mutant on CaVα2δ1. A, representative two-dimensional plots of mCherry versus FITC fluorescence are shown for each N-glycosylation mutant (NQ). The 6xNQ construct (N92Q/N184Q/N348Q/N594Q/N812Q/N876Q) was used as a template from which single point reverse mutations were introduced as indicated. As seen, only the reverse mutations Q348N and Q812N effectively expressed at the cell surface. B, representative whole-cell Ca2+ current traces obtained after recombinant expression of CaV1.2 in stable CaVβ3 cells with mCherry-CaVα2δ1-HA WT or mCherry-CaVα2δ1-HA N-glycosylation mutants (NQ). C, bar graph shows the normalized ΔMFI measured in the presence of FITC in intact (surface expression) or permeabilized cells (total expression) in flow cytometry experiments. D, averaged current-voltage relationships, recorded in the presence of 2 mm Ca2+, are shown for the reverse mutations mCherry-CaVα2δ1-HA 6xNQ + Q92N (N184Q/N348Q/N594Q/N812Q/N876Q); 6xNQ + Q184N (N92Q/N348Q/N594Q/N812Q/N876Q); 6xNQ + Q348N (N92Q/N184Q/N594Q/N812Q/N876Q); 6xNQ+ 594N (N92Q/N184Q/N348Q/N812Q/N876Q); and 6xNQ + Q812N (N92Q/N184Q/N348Q/N594Q/N876Q). As a control for relative expression, functional modulation by mCherry-CaVα2δ1-HA WT was measured under the same conditions (data not shown). See Tables 1 and 2 for statistical significance.

