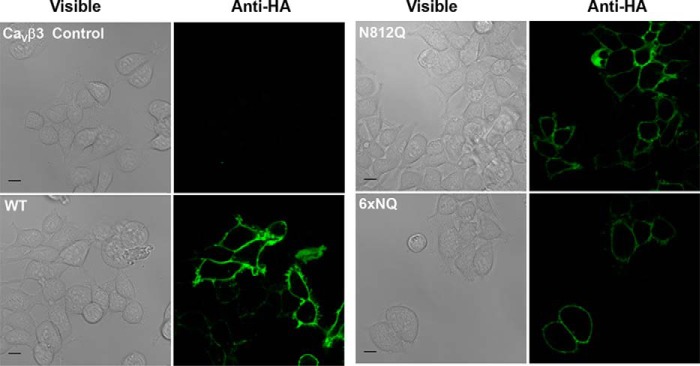
FIGURE 6.
Live cell imaging of CaVα2δ1 proteins WT and mutants. CaVβ3 stable HEKT cells were transfected with pCMV-CaV1.2 and pmCherry-CaVα2δ1-HA WT, N812Q, or 6xNQ (N92Q/N184Q/N348Q/N594Q/N812Q/N876Q). One day after transfection, live cells were incubated with the FITC-conjugated anti-HA antibody (1:100) and the nuclei were stained with DAPI (1:1000) (data not shown) in 1× PBS for 45 min at 4 °C. Confocal fluorescent images were captured with a Zeiss LSM 710 confocal microscope system with ×63/1.40 oil objective. Scale bar corresponds to 10 μm. The immunofluorescent signals from the FITC-conjugated anti-HA antibody (green) are shown to the right of the corresponding differential interference contrast images. Under these conditions, the FITC signal was mostly restricted to the cell surface of intact cells. No signal was observed in nontransfected cells (upper left quadrant) or in the absence of primary or conjugated antibody (data not shown).

