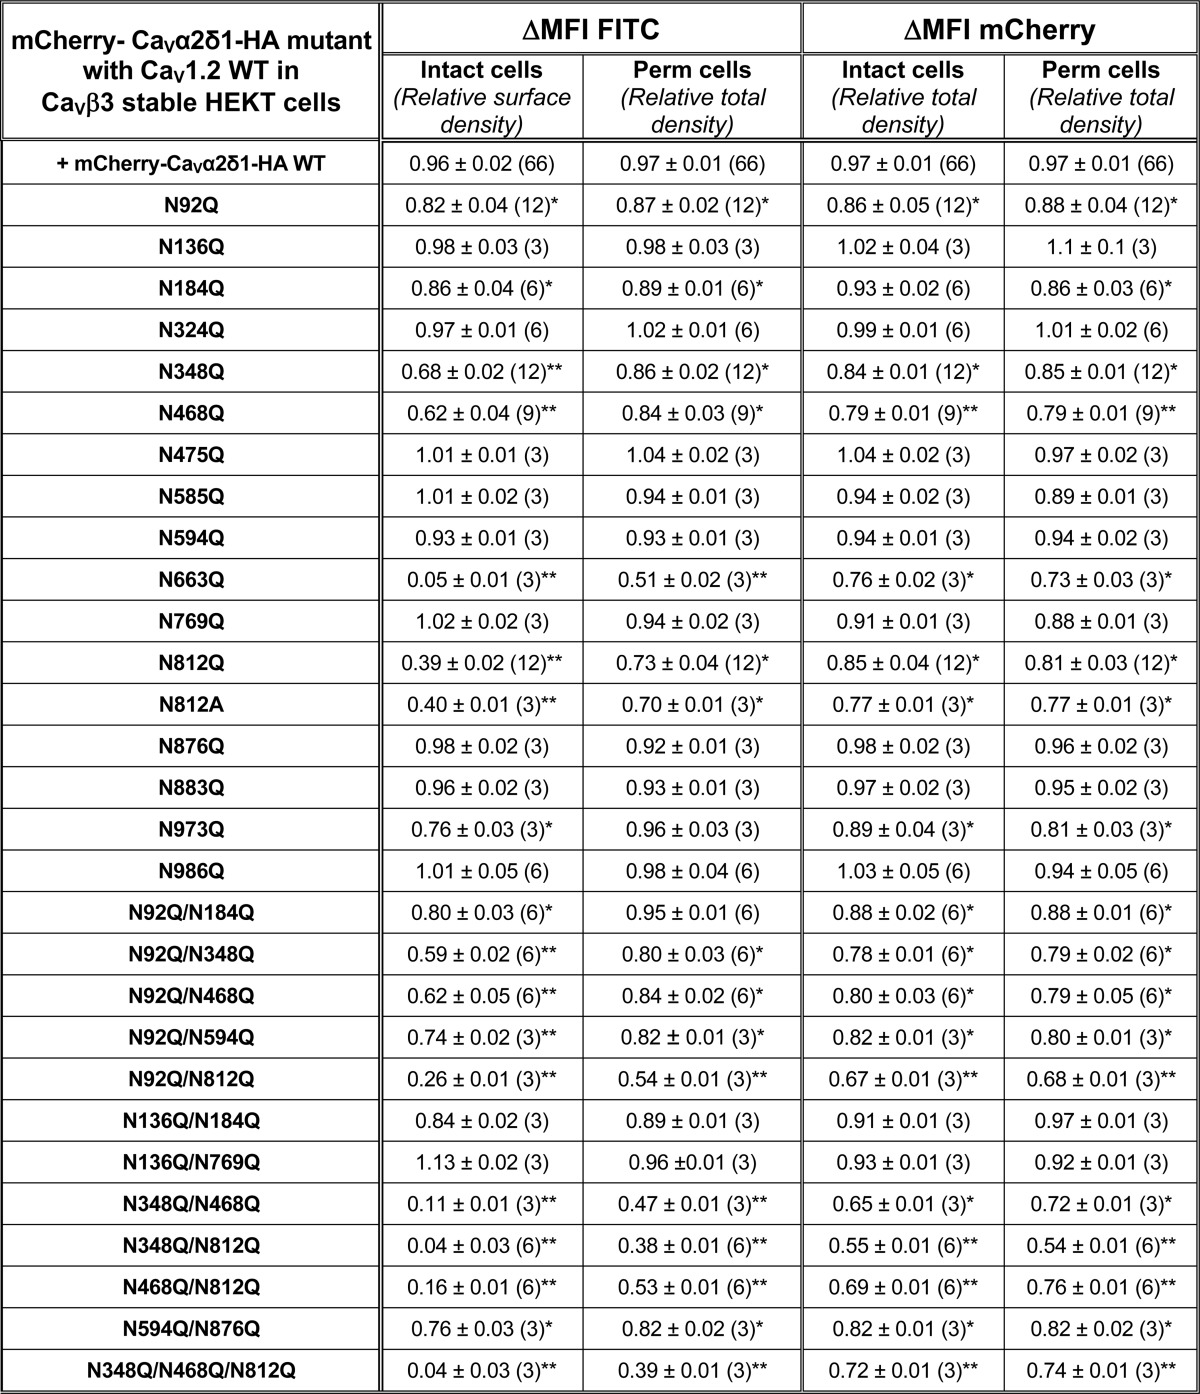
TABLE 1.
Relative fluorescence intensity ΔMFI for Cherry-Cavα2δ1-HA WT and mutants
Cav1.2 WT was co-expressed in stable Cavβ3 HEKT cells with pmCherry-Cavα2δ1-HA WT or mutant using a 1:1 DNA ratio. Flow cytometry experiments were conducted to determine cell surface expression levels of tagged proteins, and fluorescence intensity was measured with the FlowJo software as described under “Experimental Procedures.” Relative expression of Cavα2δ1 was calculated based on ΔMFI estimated for each fluorophore (mCherry or FITC). ΔMFI for FITC measured in intact non-permeabilized cells was used as an index of the cell surface density of the HA-tagged Cavα2δ1, and ΔMFI values for FITC measured in permeabilized cells reflect the total protein expression (cell surface and intracellular protein density). The ΔMFI values for the mCherry-Cavα2δ1-HA mutants were pooled and normalized to the maximum value obtained for pmCherry-Cavα2δ1-HA WT that was expressed under the same conditions and measured the same day. The total number of experiments is provided in parentheses. The ΔMFI values for FITC measured in permeabilized cells were mostly similar to the ΔMFI for mCherry measured in intact and permeabilized cells. Furthermore, the ΔMFI values for mCherry measured in intact and permeabilized cells were found to be within experimental error suggesting that cell permeabilization did not significantly alter the protein structure. Statistical analysis was carried out against the ΔMFI for FITC measured with pmCherry-Cavα2δ1-HA WT (* p < 0.05; ** p < 0.01).

