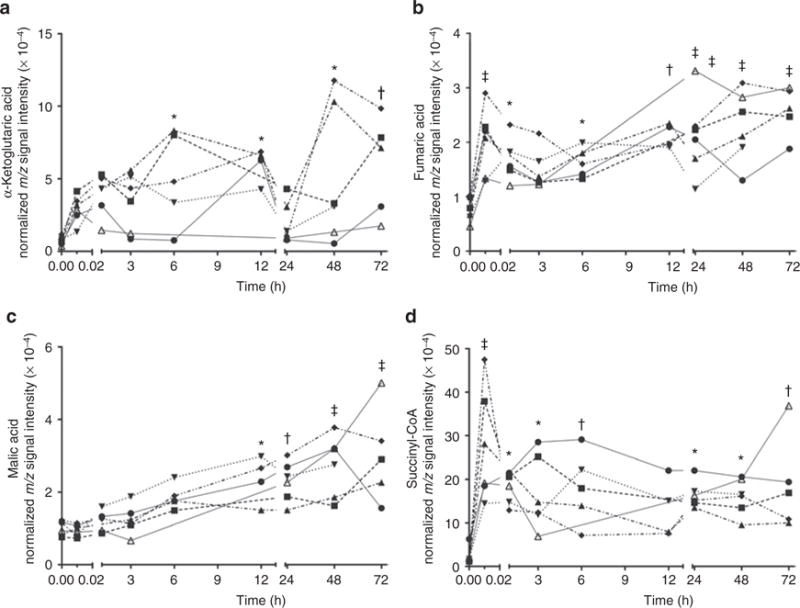
Figure 2.

Tricarboxylic acid (TCA)-cycle intermediates and the change in their normalized m/z signal intensity over the first 72 h of age. (a) α-Ketoglutaric acid, (b) fumaric acid, (c) malic acid, and (d) succinyl-CoA. Each individual line represents the change in the specified metabolite over time for each primate (P1–6) plotted independently. Each metabolite slowly increases over the time course demonstrated on the x-axis. After mixed-model ANOVA, post hoc Dunnett’s tests comparing individual time points to time point zero are demonstrated: *P < 0.05; †P < 0.01; ‡P < 0.001.
