FIGURE 3.
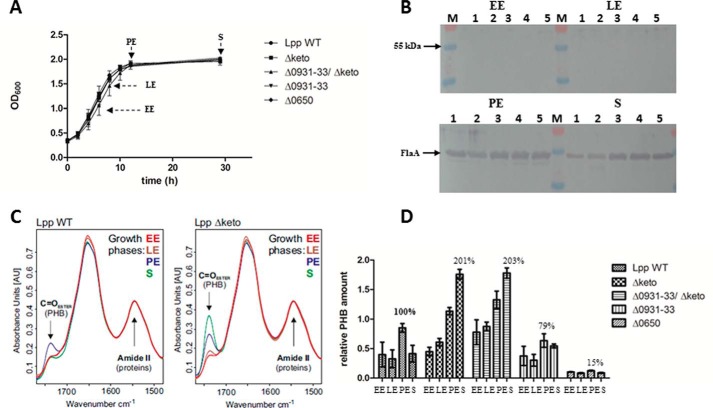
Growth phase-dependent amounts of PHB in L. pneumophila Paris WT and the isogenic mutant strains Δketo, Δlpp0931–33, Δlpp0931–33/Δketo, and Δlpp0650. A, growth curve of L. pneumophila strains grown in AYE medium at 37 °C. Time points (EE, LE, PE, and S) of PHB measurement are indicated by arrows. B, Western blotting analysis of L. pneumophila Paris WT (lane 1), Δketo (lane 2), Δlpp0931–33/Δketo (lane 3), Δlpp0931–33 (lane 4), and Δlpp0650 (lane 5) using an anti-FlaA antiserum. M, protein marker. C, preprocessed FTIR spectra demonstrating the relative amount of PHB of L. pneumophila Paris (Lpp WT) and isogenic Δketo mutant strain (Lpp Δketo) in AYE medium at 37 °C at EE, LE, PE, and S phases of growth. The C=O ester (PHB) and amide II (protein) bands are indicated. The amount of PHB in the L. pneumophila Δketo mutant strain increased in the PE and S phases when compared with the L. pneumophila WT strain. D, relative PHB amounts in L. pneumophila Paris strains investigated by FTIR spectroscopy. All values are mean values of triplicate determinations (±S.D. represented by error bars) and are given in relative intensity units (see Fig. 5). Additional values given are in percent with respect to the relative PHB content of L. pneumophila WT in the PE phase.

