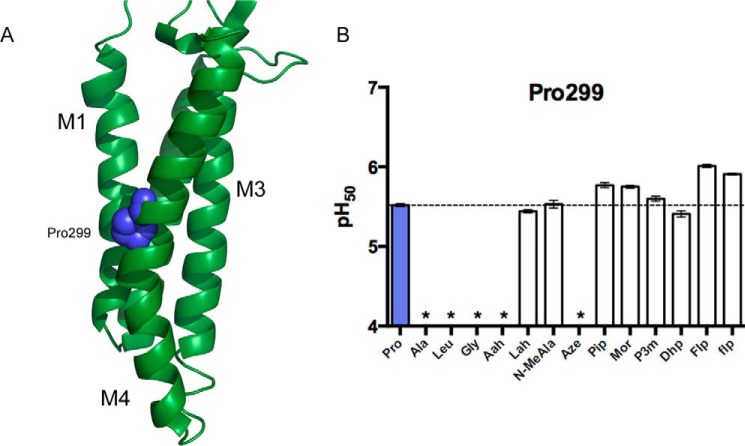
FIGURE 6.
GLIC Pro-299. A, The GLIC TM domain, highlighting Pro-299 (PDB: 3EHZ). B, pH50 values for GLIC Pro-299 mutants. Data shown are mean ± S.E., with n = 7–20. Typical maximal currents from functional mutants generated by nonsense suppression were 0.5–5 μA. *, pH-induced responses comparable with uninjected cells.

