
FIGURE 5.
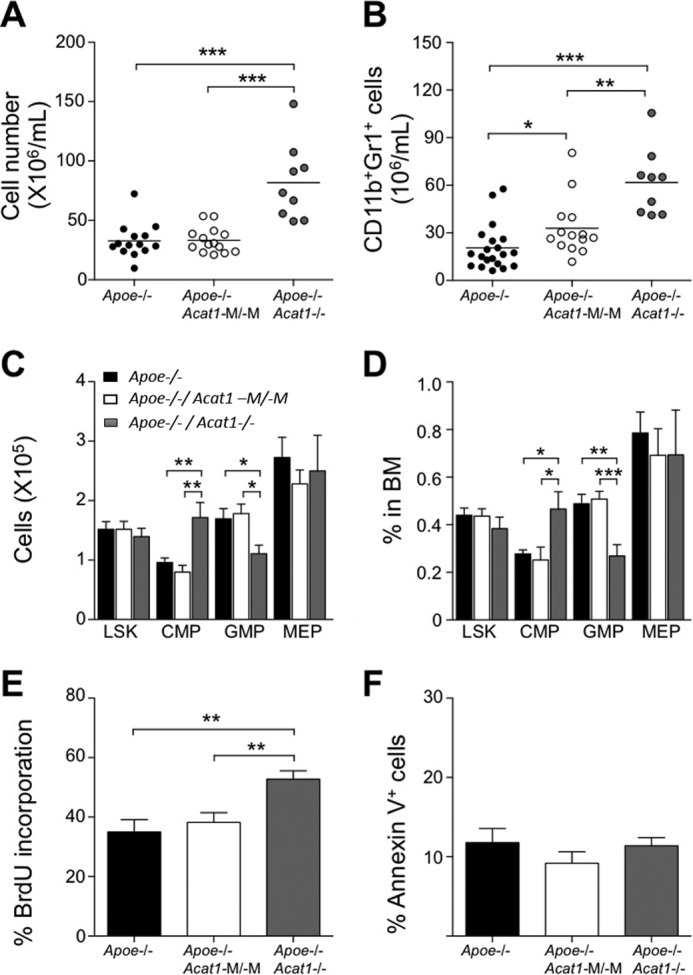
Apoe−/−/Acat1−/− mice, but not Apoe−/−/Acat1−M/−M mice on a Western diet display leukocytosis and higher LSK cell proliferation in bone marrow. Black, white, and gray columns represent results from Apoe−/−, Apoe−/−/Acat1−M/−M, or Apoe−/−/Acat1−/− mice, respectively. A and B, peripheral blood leukocyte numbers (A) and CD11b+Gr1+ myeloid cell numbers (B) were measured by flow cytometry. Horizontal bars represent mean values. Male Apoe−/−, Apoe−/−/Acat1−M/−M, and Apoe−/−/Acat1−/− mice were fed a Western diet for 6 weeks after they reached 8 weeks of age. Each circle represents a result from one animal (n = 9–20 mice/group). C and D, LSK, common myeloid progenitor (CMP), granulocyte/macrophage progenitor (GMP), and megakaryocyte/erythrocyte-restricted progenitor (MEP) cells in BM were quantified by flow cytometry. Results are reported as total number (C) and percentage of total cell numbers within the BM (n = 9–20 mice/group) (D). E and F, proliferation and apoptosis of LSK cells were quantified by bromodeoxyuridine (BrdU, E) or Annexin V staining (F) (n = 8–10 mice/group). Results are reported as mean ± S.E. *, p < 0.05; **, p < 0.01; ***, p < 0.001.