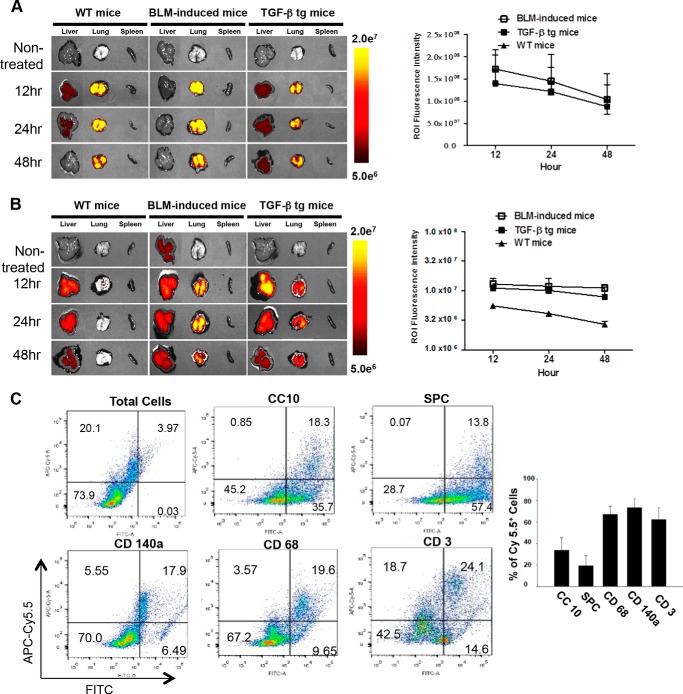
FIGURE 3.
In vivo biodistribution of SAMiRNA in bleomycin and TGF-β Tg animal models of fibrosis. A, left panel, time kinetic ex vivo fluorescence images after intratracheal instillation of Cy5.5-labeled SAMiRNA in bleomycin (BLM)-induced fibrosis and TGF-β Tg mice. Right panel, quantitative kinetic evaluation of fluorescence intensity by measuring region of interest (ROI) values. B, left panel, time kinetic ex vivo fluorescence images after intravenous injection of Cy5.5-labeled SAMiRNA nanoparticles in WT, bleomycin-challenged, and TGF-β Tg mice. Right panel, quantitative kinetic evaluation of fluorescence intensity by measuring region of interest values. C, representative flow cytometric analysis on the SAMiRNA-targeted cells in the lung. 24 h after intratracheal injection of 3 mg/kg APC-Cy5.5-labeled SAMiRNAs into TGF-β Tg mice, lung cells were isolated and subjected to flow cytometric evaluation using FITC-labeled cell specific markers: Clara cell 10Kd (CC10) for airway epithelial cells, surfactant protein C (SPC) for alveolar epithelial cells, CD140a (mesenchymal cells, including fibroblasts and myofibroblasts), CD68 (macrophages), and CD3 (T cells). At least 10,000 cells/sample were analyzed. The percentages of Cy5.5-positive (+) SAMiRNA-targeted cells in each group of cells defined by cell surface marker are represented separately (n = 4 each, right panel). A and B, the ex vivo fluorescence images are representative of a minimum of 4 mice/group. The region of interest quantitation represents mean ± S.E. of evaluations with a minimum of four mice.

