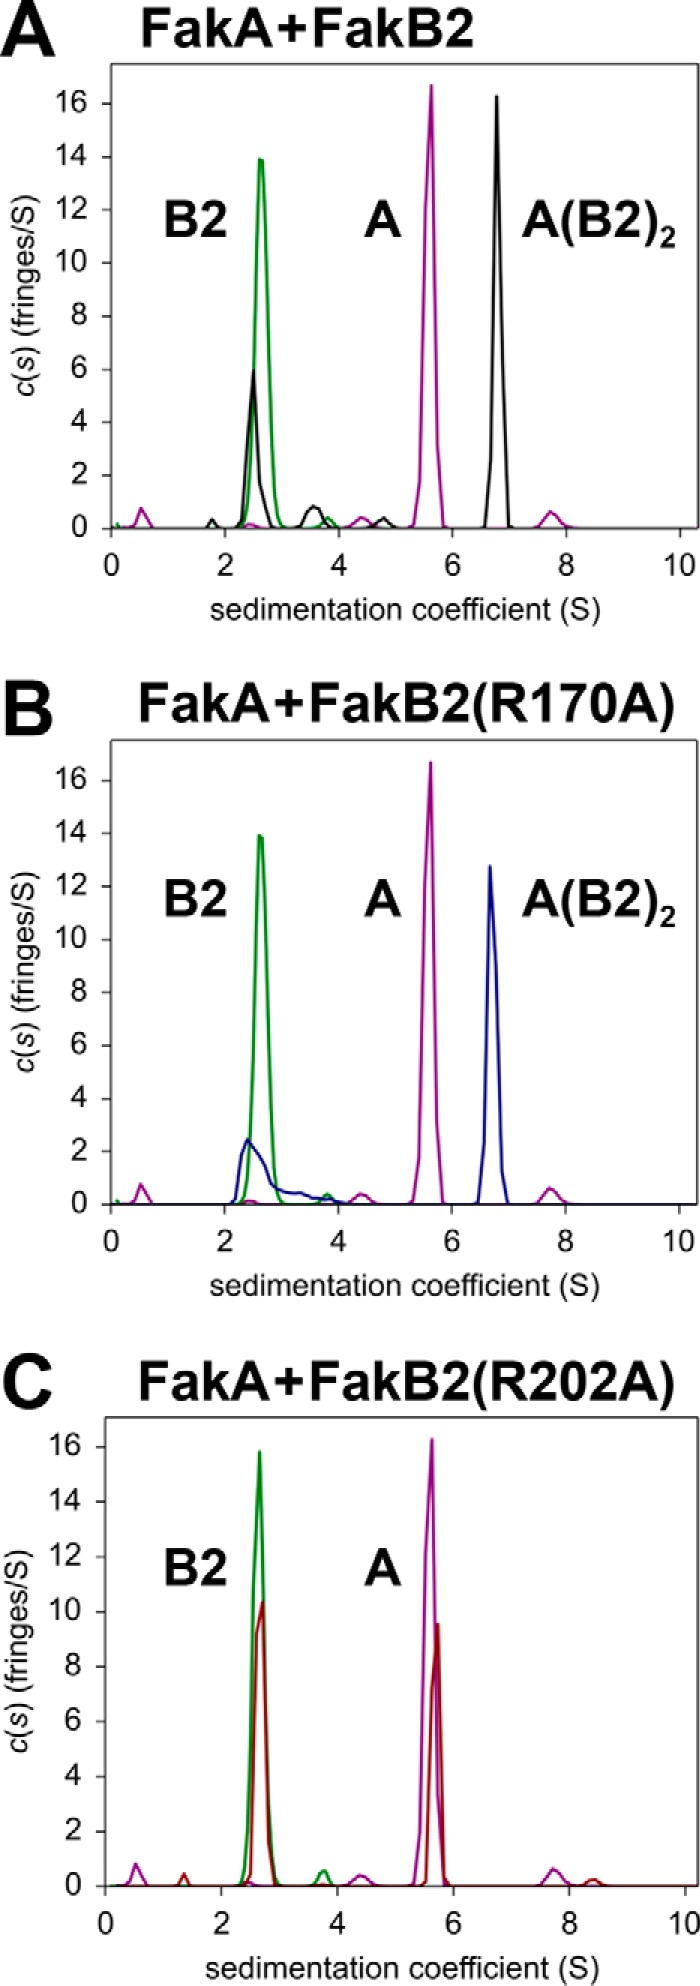
FIGURE 5.

Analysis of FakA-FakB2 binding by analytical ultracentrifugation. A–C, sedimentation velocity profiles (fringe displacement) were fitted to a continuous sedimentation coefficient distribution model c(s). The figure illustrates representative examples of three individual experiments. The s-values for proteins and complexes calculated from experiments with all the mutant proteins are listed in Table 3. All plots show the individual locations of the FakA dimer (purple) and the FakB2 monomer (green) in the experiment. The peaks are labeled to denote a monomer of FakB2 (B2), a dimer of FakA (A) or the complex containing a FakA dimer and two FakB2 molecules (A(B2)2). A, FakA + FakB2 (black). B, FakA + FakB2(R170A) (blue). C, FakA + FakB2(R202A) (red). Additional details are found under “Experimental Procedures.”
