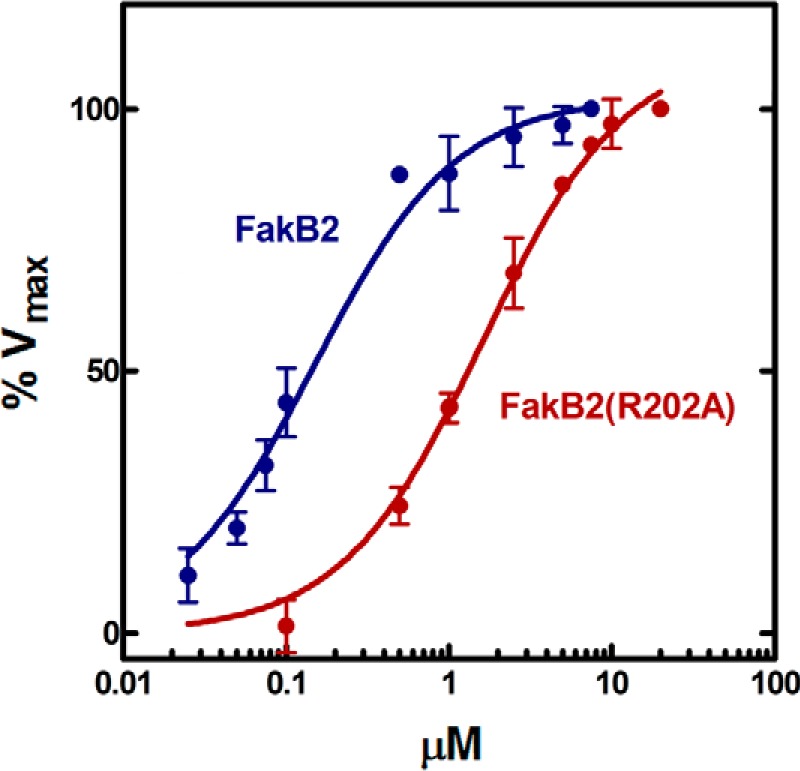
FIGURE 6.

FakB2(R202A) exhibits a lower affinity for FakA. The standard radiochemical Fak assay described under “Experimental Procedures” was used to compare the apparent Km values for FakB2 and FakB2(R202A). The apparent Km value for FakB2 was 0.16 ± 0.02 μm, and the apparent Km value for FakB2(R202A) was 1.67 ± 0.17 μm. The Km values were calculated using non-linear Michaelis-Menten regression analysis using GraphPad software.
