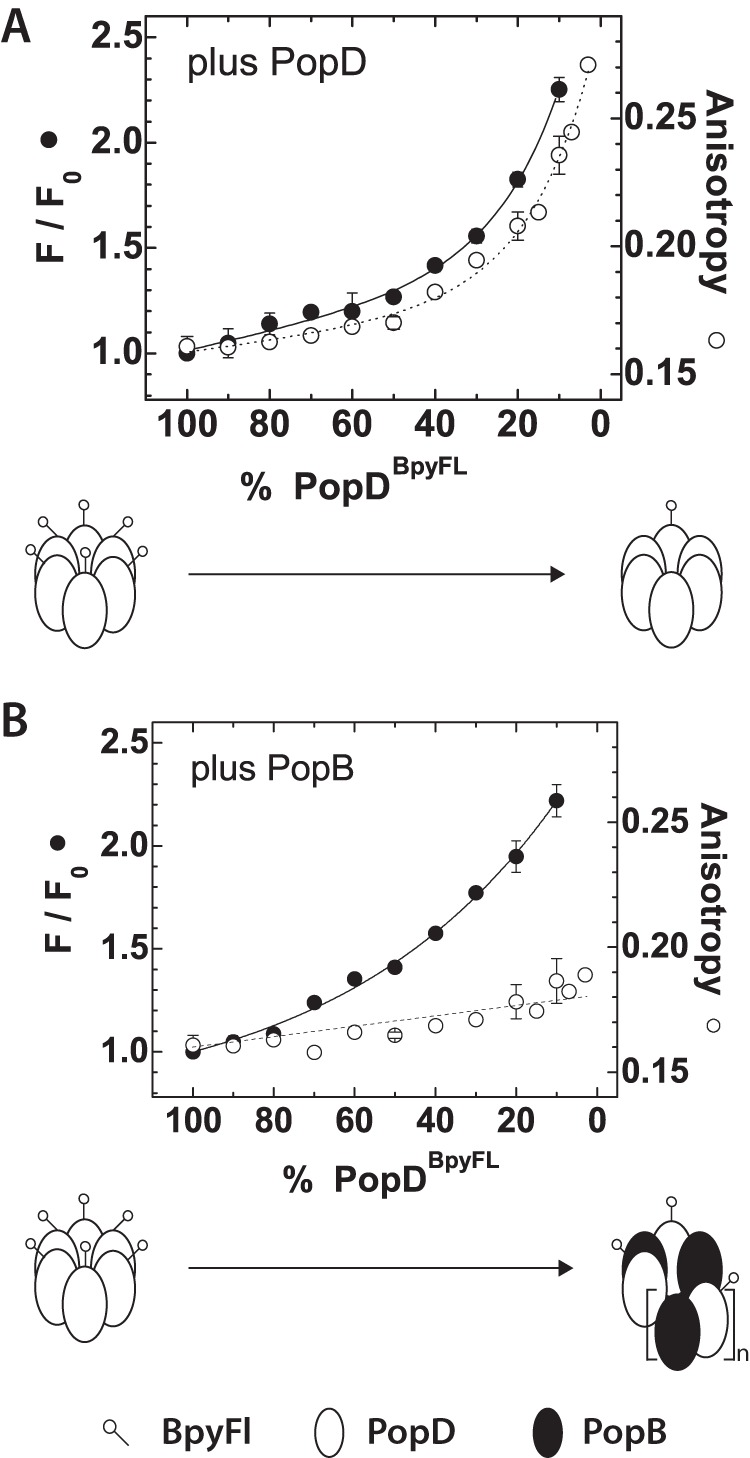
FIGURE 3.

PopD assembled homo- or hetero-oligomeric structures in membranes. Fluorescence intensity and anisotropy changes observed upon the dilution of PopDBpyFL with increasing amounts of PopDWT or PopBWT. A, steady-state fluorescence intensity and anisotropy of PopDBpyFL measured at the indicated percent of labeled protein when diluted with PopDWT. B, steady-state fluorescence intensity and anisotropy of PopDBpyFL when diluted with PopBWT. Scheme indicating the labeled PopDBpyFL distribution expected for complexes containing 100% labeled PopD or a mixture of proteins containing 3% labeled PopDBpyFL, are shown at the bottom of each figure. PopD complexes were drawn as hexamers and hetero-complexes as (PopD-PopB) n-mers for simplicity. Error bars represent the data range of at least two independent assays. Average lines are shown as a guide for the reader.
