
FIGURE 2.
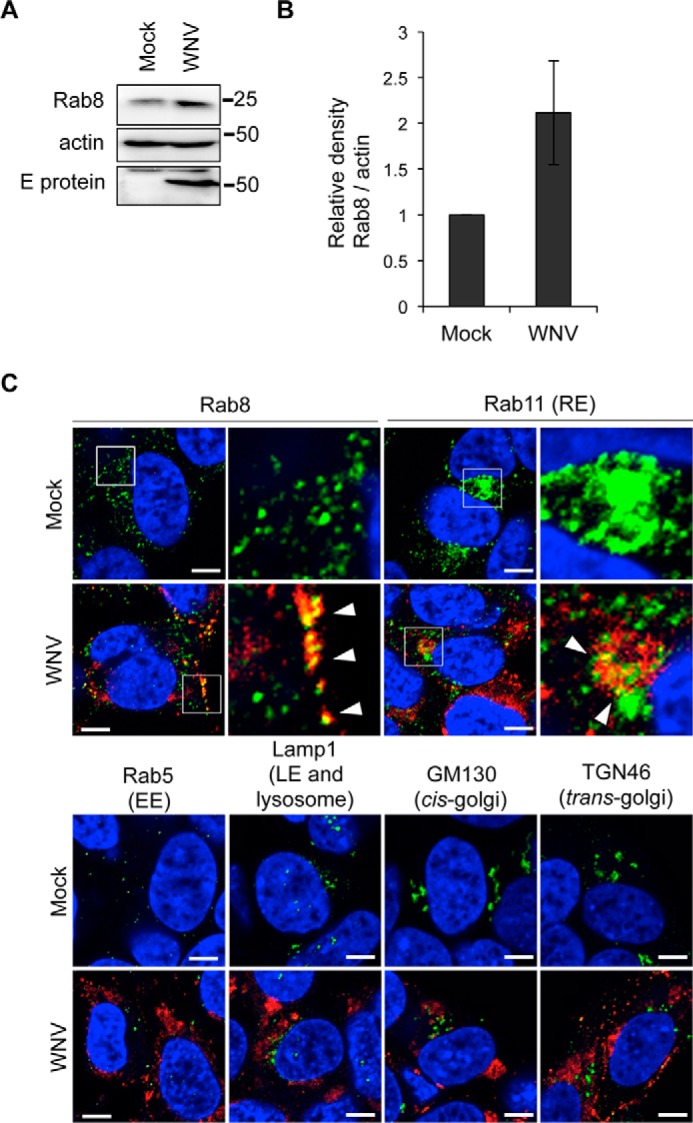
Rab8 expression and localization are controlled by WNV infection. A, Rab8 expression levels in WNV-infected cells. SH-SY5Y cells were mock-infected (Mock) or infected with WNV (1 Pfu/cell). Cells were harvested at 48 hpi and analyzed by immunoblotting for Rab8, E protein, and actin. B, quantified result of A. The bar graph represents relative Rab8 band densities that were normalized for actin band densities. Data represent mean ± S.D. of three independent experiments. C, intracellular localization of viral protein and each organelle marker. SH-SY5Y cells were mock-infected (Mock) or infected with WNV (1 Pfu/cell). Cells were harvested at 48 hpi and stained with each organelle marker (green) and WNV antigen (red). Cell nuclei were counterstained with DAPI (blue). Arrowheads indicate colocalization of viral antigen and each organelle marker. Scale bars: 5 μm. Boxed areas in Rab8 and Rab11 were magnified in right panels.