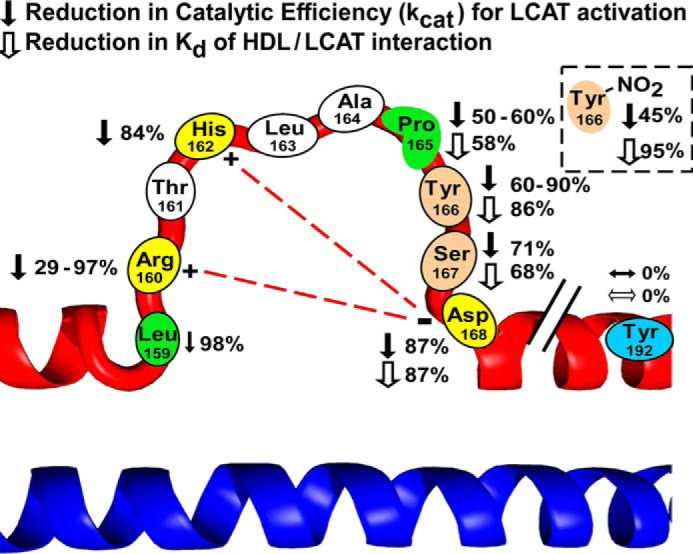
FIGURE 6.

Schematic illustrating the amino acids in the solar flare region of apoA-I in HDL that affect LCAT activation and HDL/LCAT binding affinity. Shown is a schematic of a highly solvent-exposed loop domain of apoA-I, the so-called SF region, and mutations on each amino acid residue leading to reduction in the catalytic efficiency of LCAT activation (filled arrow) and HDL/LCAT binding affinity (open arrow). The post-translational modification at Tyr166 also reduced the catalytic efficiency of LCAT activation and HDL/LCAT binding affinity (box in the right corner). Previously proposed salt bridges between Arg160, His162, and Asp168 are shown with a red dashed line.
