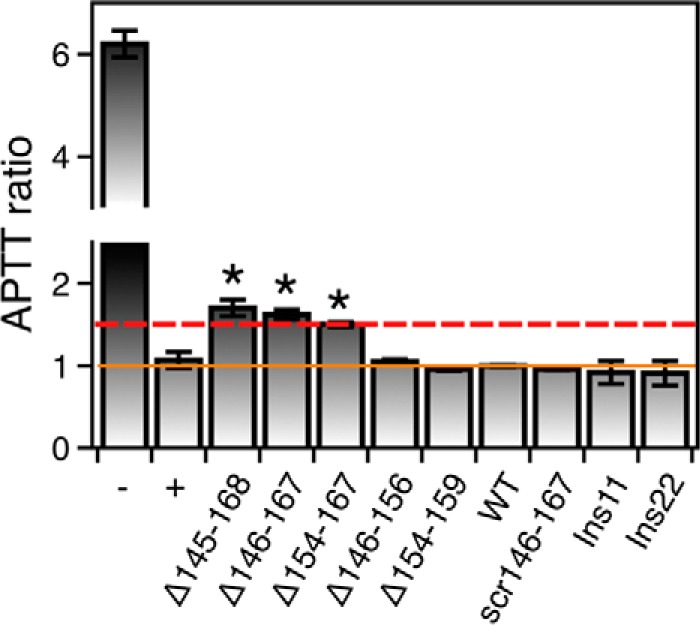
FIGURE 5.

Effect of perturbation of Lnk2 on the aPTT. aPTT values are shown as the ratios of the test to normal, prothrombin wild type (30 ± 2 s). Additional reference values are 32 ± 3 s for plasma collected from a healthy donor (positive control, +) and 185 ± 8 s for prothrombin deficient plasma (negative control, −). The solid orange line identifies the baseline, and the dashed red line highlights the critical value of 1.5. Prothrombin constructs ProTΔ145–168, ProTΔ146–167, and ProTΔ154–167 show significant prolongation of the aPTT (1.50 ± 0.03-, 1.62 ± 0.06-, and 1.72 ± 0.08-fold, respectively). Each measurement is the average of six individual determinations.
