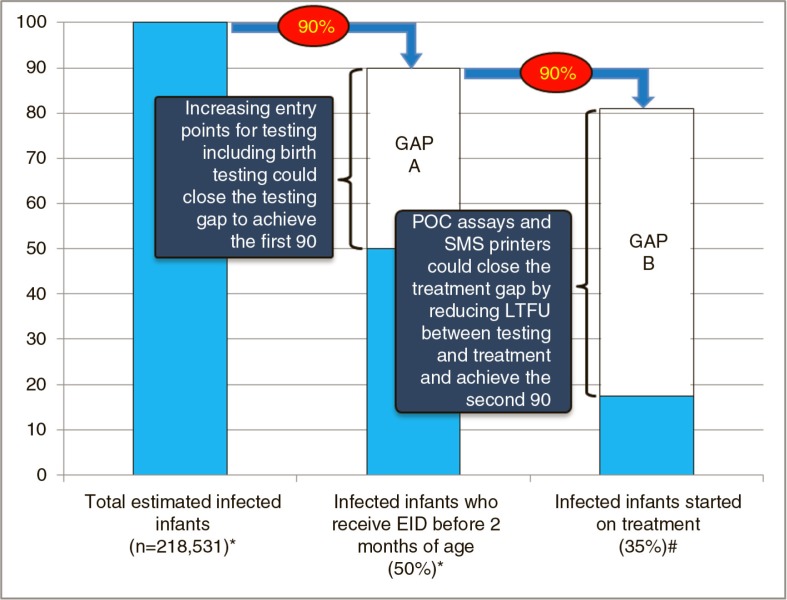
Figure 1.
Estimated annual proportion of infected infants tested by two months of age in 2014 and estimated proportion of identified infected infants treated. Gap A represents the difference between infants currently receiving early infant diagnosis and the testing target of 90% of all positives, while Gap B represents the difference between infants treated and the treatment target of 90% of identified positives.
Data sources: *Estimated number of new child infections in 2014 and estimated coverage of early infant diagnosis testing in 2014 taken from Global AIDS Response Progress Report, WHO, Geneva 2015 [7]. #Proportion of infected infants receiving treatment from Chatterjee et al. BMC Public Health, 2011 [8].

