Figure 4.
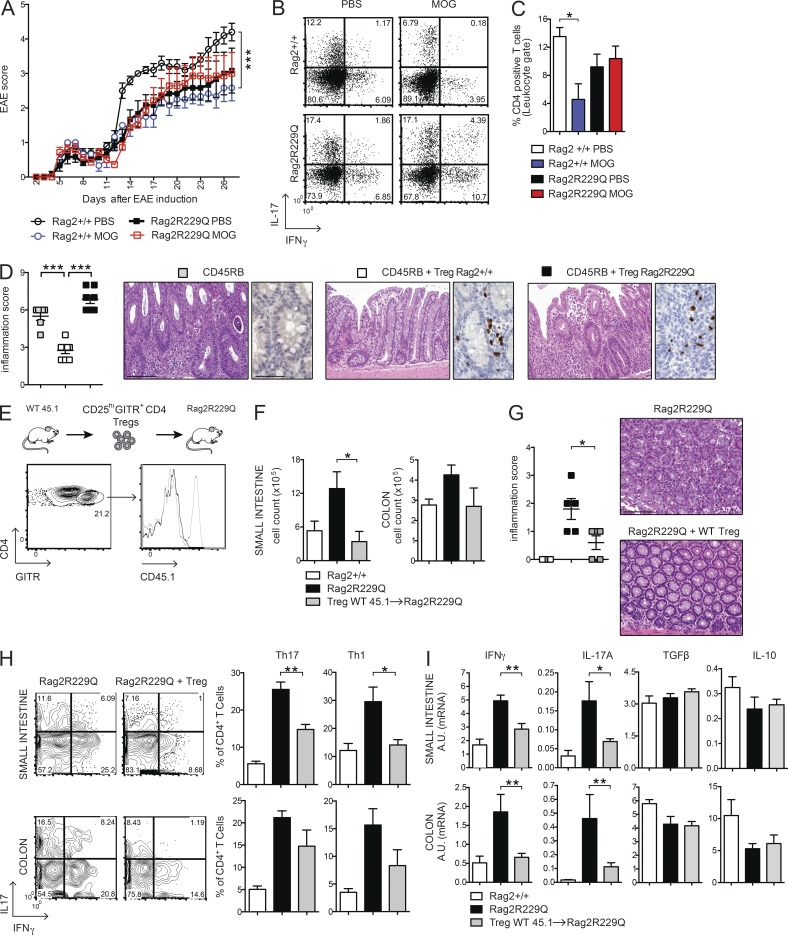
Oral tolerance is impaired in Rag2R229Q mice, and transfer of WT T reg cells attenuates gut inflammation. (A) EAE model of oral tolerance in Rag2R229Q mice. EAE induction and progression was scored from days 0 to 26 in mice orally administered with MOG35–55 or PBS. (B) Cytokine production profile of CD4+ T cells. At day 26, the mice were sacrificed, and total splenocytes were stimulated ex vivo with MOG35–55. The numbers in the plots indicate the frequency of cells in each quadrant. (C) Frequency of CD4+ T cells infiltrating the brain of Rag2+/+ and Rag2R229Q mice. Data are shown from one representative experiment out of two (n = 6–7 mice/group). (D) Colitis score and representative colonic sections from Rag1−/− transferred with CD45RB alone or with T reg cells from Rag2+/+ and Rag2R229Q mice stained with H&E and CD3 immunostaining. Cumulative score results of two independent experiments are shown (n = 6–8 mice/group). (E) WT CD45.1+CD25hiGITR+CD4+ T reg cells were adoptively transferred into Rag2R229Q mice. Histogram plot show the CD45.1 expression on GITR+CD4+ T cells in the LP of recipient Rag2R229Q mice. (F) Total cell counts from SI and colonic LP. (G) Representative colonic sections stained with H&E and colitis score in Rag2R229Q mice recipient mice and controls (n = 5 from two experiments). (H) Representative FACS plots and frequency of LP Th17 and Th1 cells from SI and colon. (I) SI and colonic tissue expression of cytokines. RNA contents are shown as arbitrary units (A.U.). Data shown are cumulative results from two independent experiments with nine mice per group. Bars, 100 µm. Values are mean ± SEM. *, P < 0.05; **, P < 0.01; ***, P < 0.001.

