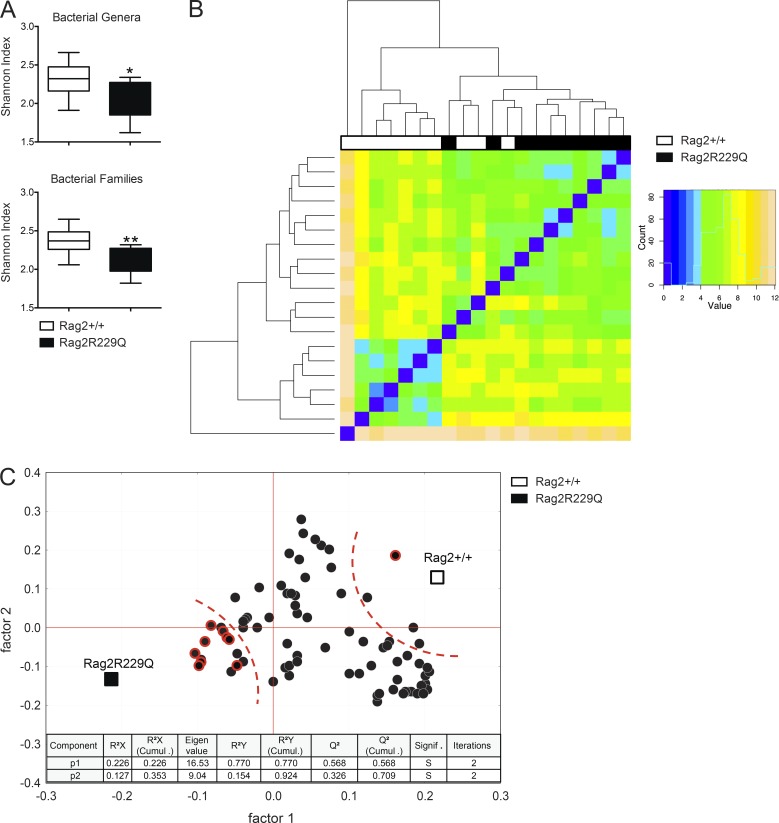
Figure 6.
Rag2R229Q mice show altered microbiota composition. Adults Rag2+/+ and Rag2R229Q littermates were cohoused for 2 mo after the weaning. Cecum fecal content was analyzed for microbiota profiling with 16s sequencing. (A) Box and whisker plots of the Shannon diversity index calculated at the bacterial genera and family level. (B) Heat map visualization at the family level, which was obtained applying the DESeq package on the taxonomic data produced by BioMaS. (C) Correlation between mouse genotype and bacterial genera in fecal samples. X and Y loading plots (factors 1 and 2) were obtained by partial least squares analysis performed by using the genotype as categorical response and relative abundance of bacterial genera as continuous predictors. Taxa belonging to the phylum Proteobacteria are shown with a red circle. 92% of sum of squares is explained by the first two extracted components. *, P < 0.05; **, P < 0.01.

