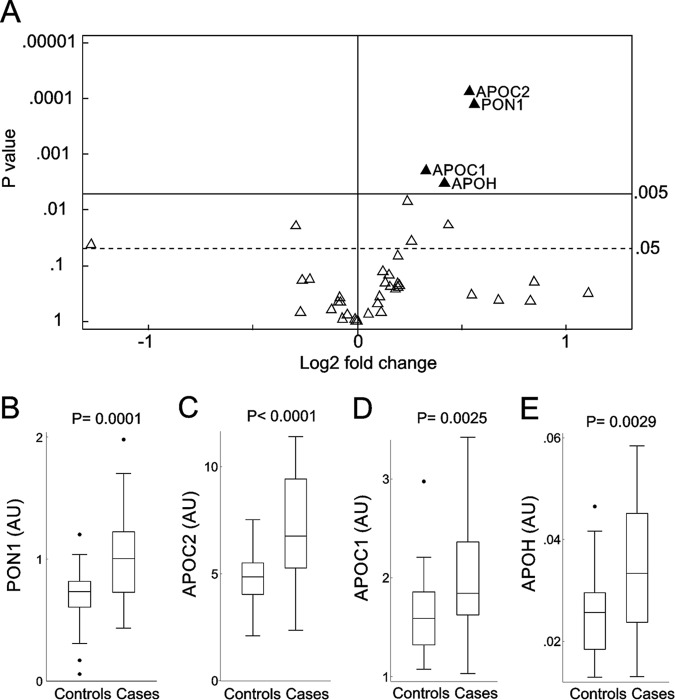
Fig. 2.
PRM analysis of HDL proteins in case and control subjects. Proteins measured by PRM (A). For each protein, the p value from the two-sample t test is plotted against the log2 fold change between cases and controls. Proteins overexpressed in cases are displayed to the right of the value 0 on the x axis, while underexpressed proteins are to the left. After we controlled for multiple comparison testing, only proteins situated above the p value of 0.005 on the y axis were considered significantly different between cases and controls. The solid horizontal line shows the corrected overall critical p value threshold (p = 0.005). The dashed horizontal line shows the uncorrected overall critical p value of 0.05. Box plots of PON1 (B), APOC2 (C), APOC1 (D), and APOH (E) in case and control subjects. Peptides were quantified as the integrated peak area relative to that of [15N]APOA1 peptide ([15N]DYVSQFEGSALGK). The box plots show the distribution of the data (median, interquartile ranges), while the dots represent outliers. AU, arbitrary units.

