Fig. 1.

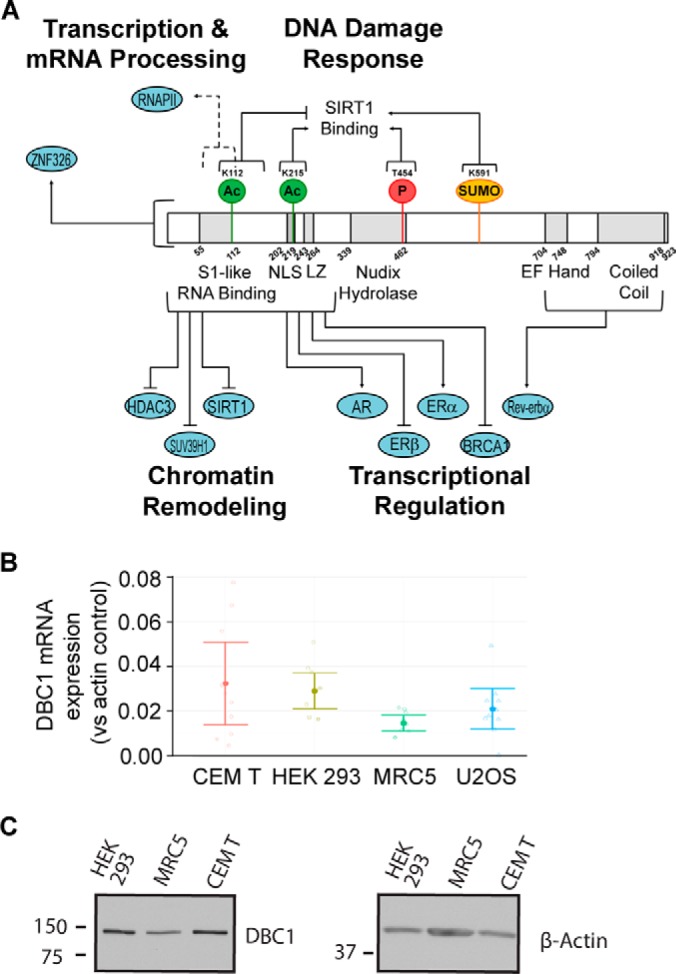
DBC1 domains, regulatory functions, and relative mRNA levels in different cell types. A, Model of DBC1 structure with predicted domain boundaries and direct interacting partners. Numbers indicate amino acid positions. Functionally characterized post-translational modifications (PTMs) are indicated. B, Endogenous mRNA expression of DBC1 in wild-type HEK 293, CEM T, U2OS, and MRC5 cells determined by qRT-PCR, was normalized to endogenous β-actin (ΔCt) for each cell type. Fold change (2−ΔCt) is plotted for each cell type. Mean fold change (solid circle) and 95% confidence intervals (error bars) are indicated. n = 10 biological replicates and n = 3 technical replicates for each biological replicate. C, Endogenous DBC1 protein levels in wild-type HEK 293, MRC5, and CEM T cells assessed by Western blotting. Loading was normalized by equal cell number (75,000 cells/sample).
