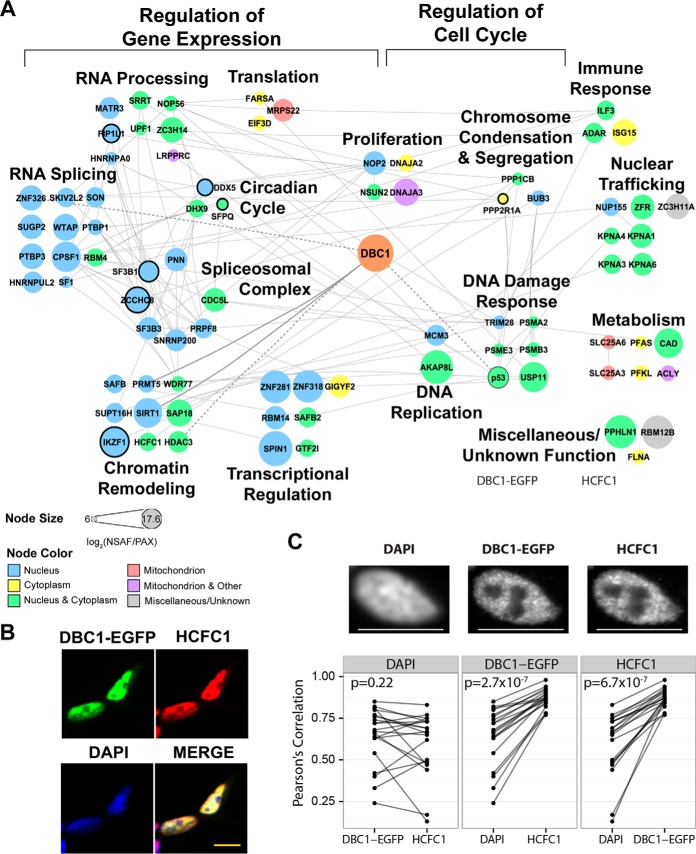
Fig. 5.
Functional DBC1 interaction network in CEM T cells. A, DBC1 interaction network of 82 SAINT-filtered (SAINT p > 0.90) protein interactions identified in CEM T cells (n = 4 biological replicates). Nodes indicate individual proteins; edges, known protein interactions (curated by STRING-db); bold edge, previously known DBC1 interactions). Node color indicates subcellular localization. Node size indicates NSAF/PAX values. Nodes with black borders indicate proteins causally associated with cancer (COSMIC database). B, Representative immunofluorescence microscopy images of fixed DBC1-EGFP HEK293 cells stained for HCFC1 (red), DBC1-EGFP (EGFP, green), and DAPI (nucleus, blue). Scale bar, 10 μm. C, Additional assessment of HCFC1 and DBC1-EGFP colocalization within subnuclear regions. Pearson's correlation coefficients were calculated from pixel intensities between each paired combination of the three channels (DAPI, DBC1-EGFP, and HCFC1). n = 20 cells for each experiment. The points in each box represent the correlation coefficients between one of the channels (base channel) and two other channels individually. The coefficients obtained from the same cell are connected by a line to represent the difference in correlation from the base channel to the other two other channels. Paired t test p values assess whether there is a significant difference in correlation between the base channel and the other two channels.

