Fig. 4.
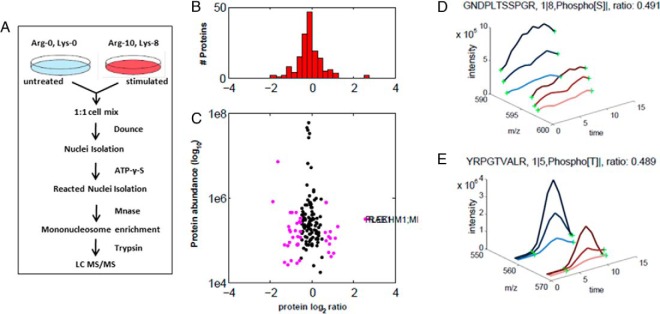
Analysis of PS-ChAP SILAC results under amanitin treatment for identifying phosphorylation events related to gene transcription. (A) Light amino acids (Lys0; Arg0) or heavy amino acids (Lys8; Arg10) were used for the SILAC experiment. Untreated cells were grown in the light medium while the stimulated cells were grown in the heavy medium. Cells were mixed in a 1:1 ratio, and whole cell lysis was performed before nuclei isolation and Mnase digestion. As described in Fig. 3, thiophosphorylated sites on the mononucleosomes can be specifically detected from nanoLC-MS/MS after thiophosphorylated mononucleosome enrichment. Light-labeled HeLa cells served as a control while heavy-labeled HeLa cells were treated with α-amanitin for 24h. (B) Histogram of log2-transformed normalized protein ratios for all quantified proteins identified in the experiment. (C) Plot of the normalized ratios of all quantified proteins plotted against their summed heavy and light peptide intensities. (D) MS-based quantification analysis of a phosphopeptide on MCM2 (GDPLTSpSPR) that displays a decreased abundance during inhibition of transcription. The SILAC peptide pair shows a heavy to light ratio (H/L) of 0.489 corresponding to a more than twofold reduction of the protein level. (E) MS-based quantification analysis of another peptide on histone H3 (YRPGpTVALR). The SILAC peptide pair shows a heavy to light ratio (H/L) of 0.491 also corresponding to about twofold reduction of the protein level.

