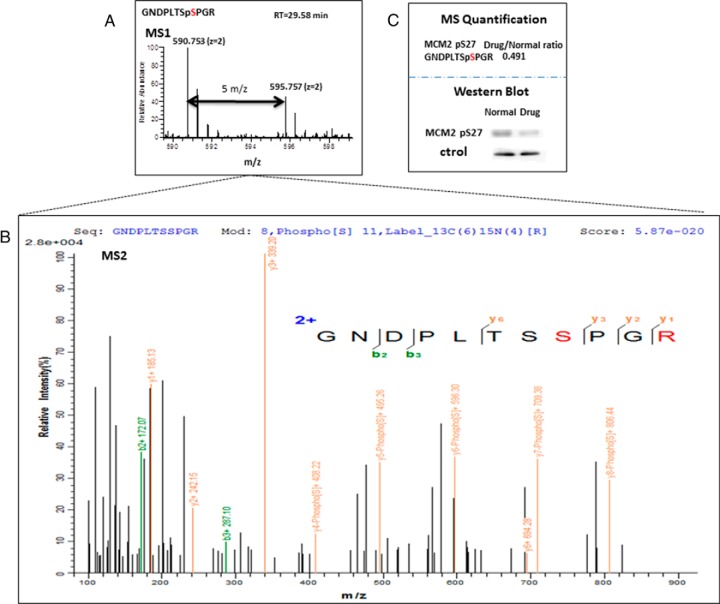
Fig. 5.
Quantitative SILAC-based proteomics and PS-ChAP reveal phosphorylation events related to gene transcription. (A) Pairs of chemically identical peptides (GNDPLTSpSPGR) with a different stable-isotope composition can be differentiated by mass spectrometry due to the mass difference between the pair (Δm = 5 m/z). The relative protein abundance was reflected by comparing the differences in the intensities of the peaks. (B) MS/MS spectra obtained for GNDPLTSpSPGR ([M+2H]2+ = 595.758). The sequence, modification, and peptide spectrum match score are listed on the top of the figure. The y-type fragment ions are shown in yellow while the b-type fragment ions are shown in green. (C) MS quantification result of GNDPLTSpSPGR from combined control and α-amanitin treated cells were obtained by using pQuant. Western blotting results are shown in the second part of the panel and are consistent with the MS observations.

