Fig. 7.
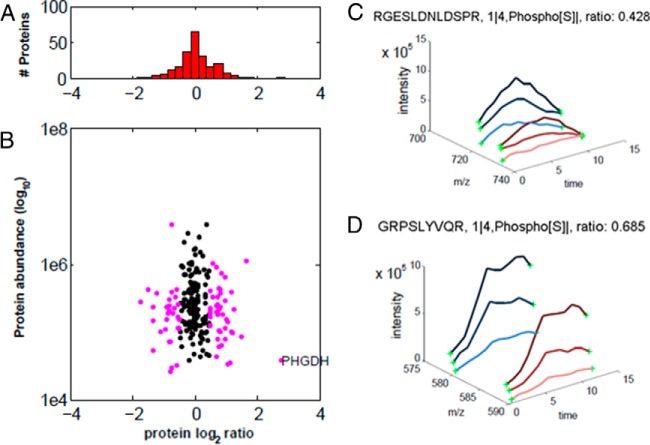
PS-ChAP SILAC-based quantitative proteomics analysis during serum deprivation followed by serum replenishing. Light-labeled HeLa cells were serum starved for 72 h and heavy-labeled HeLa cells were starved 72 h then refed with 10% FBS serum for 4 h. (A) Histogram of log2-transformed normalized protein ratios for all quantified proteins identified in the experiment. (B) Plot of the normalized ratios of all quantified proteins plotted against their summed heavy and light peptide intensities. (C) MS-based quantification analysis of the LMO7 peptide (RGESLDNLDpSPR). SILAC peptide pair shows a heavy to light ratio (H/L) of 0.428 corresponding to a more than twofold reduction of the protein level. (D) MS-based quantification analysis of the C19orf21 peptide (GRPpSLYVQR). SILAC peptide pair shows a heavy to light ratio (H/L) of 0.685 corresponding to slightly less than twofold reduction of the protein level.

