Fig. 9.
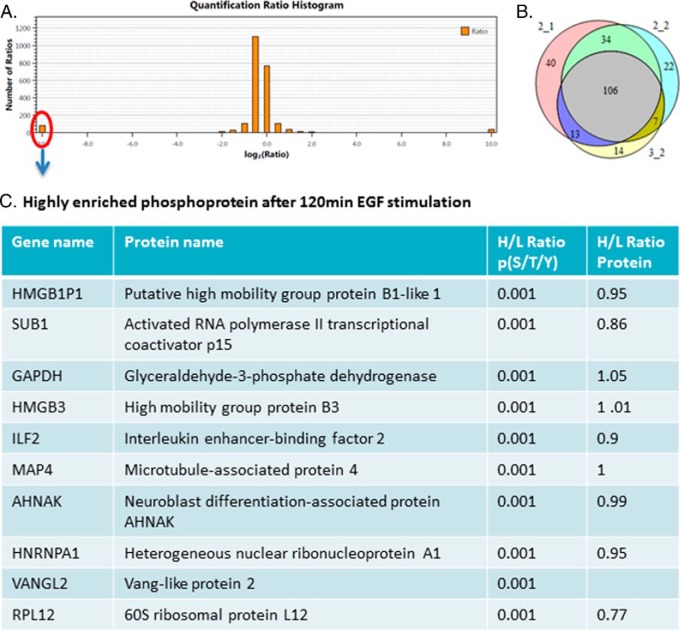
SILAC-based quantitative proteomics for temporal analysis of EGF signaling network. 120 min EGF-stimulated cells were grown in the standard “light” medium and non-stimulated cells were grown in the medium containing isotopically heavy l-arginine and l-lysine. (A) Histogram of log2-transformed normalized peptide ratios (heavy/light) for all quantified peptides identified in the experiment. (B) Number of proteins identified in three biological replicates. (C) Table listing some of the highly enriched phosphoproteins after 120 min EGF stimulation. The first line is the gene name, second line is the protein name, third line is the phosphopeptide ratio, and the last line is the protein ratio according to the ratio of many nonphosphopeptides of the protein found in the flow-through.

