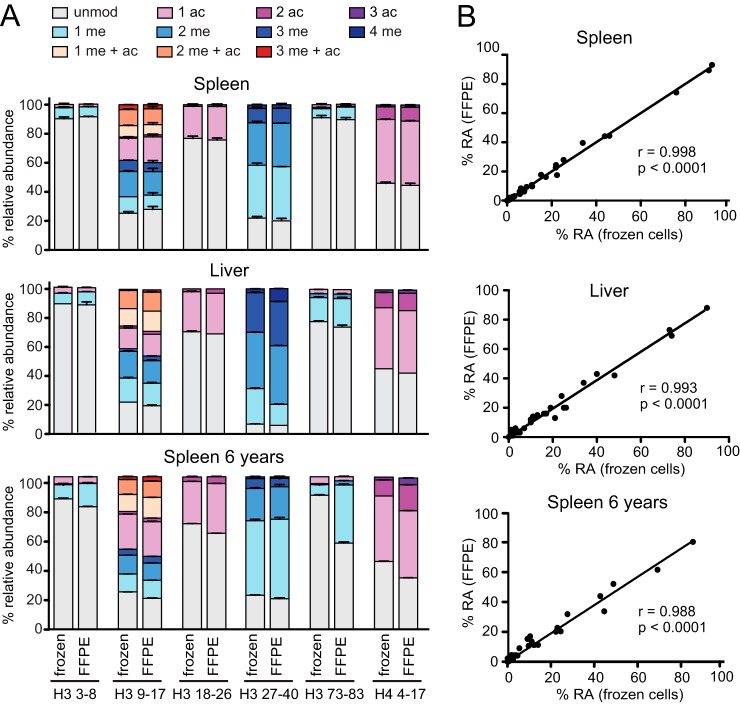
Fig. 2.
Proteomic quantification of hPTMs from mouse FFPE tissues. A, Percent relative abundances (%RA) profiles for H3 and H4 peptides from frozen or FFPE samples for mouse spleen (top panel) or liver (middle panel) stored for few weeks or mouse spleen stored for 6 years (bottom panel). Error bars represent the standard error from two independent experiments (top panel) or duplicate measurements (middle and bottom panels). B, hPTM %RA correlation between frozen cells and FFPE samples obtained from the mouse and liver spleen samples shown in panel A. Pearson correlation coefficients (r) and p values are shown. The spleen tissues stored for few weeks or 6 years derive from different mice.

