Fig. 3.
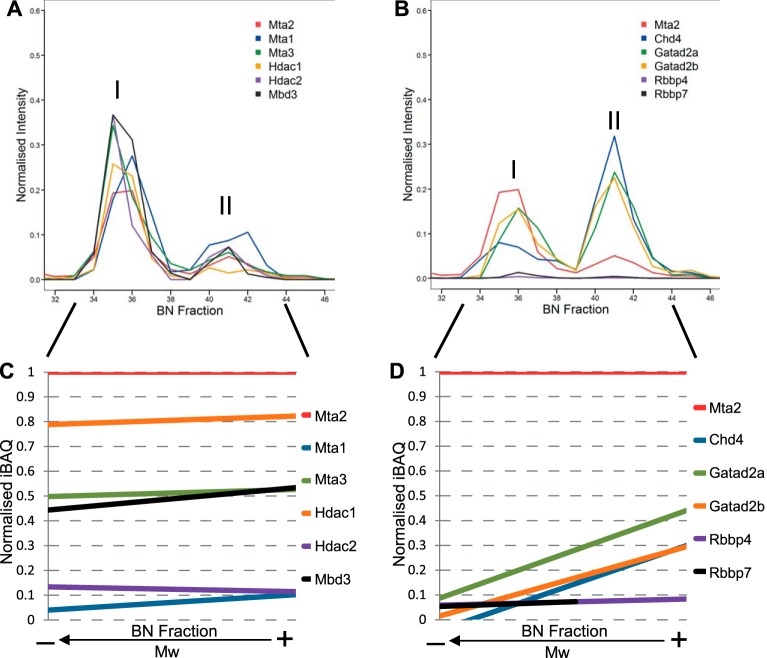
The core NuRD complex subunits associate in two distinct entities. A, Migration profiles for core NuRD subunits Mta1/2/3, Hdac1/2, and Mbd3 across the BN-PAGE separation length. B, Migration profiles for core NuRD subunits Chd4, Gatad2a/b, and Rbbp4/7 across the BN-PAGE separation length. Only fractions from the range of interest (32–46) in a representative experiment are displayed. C, Linear regression plot of normalized iBAQ values relative to Mta2 for Mta1/2/3, Hdac1/2, and Mbd3 outlining their similarity to the migration profile of Mta2. Intensity-based total quantification (iBAQ) values were computed for each identified protein in each fraction. Values were normalized against the bait Mta2 iBAQ value. D, Linear regression plot of normalized iBAQ values relative to Mta2 for Chd4, Gatad2a/b, and Rbbp4/7. Chd4 and Gatad2a/b show steep ascending trends indicative of their different contribution to the two NuRD entities. The linear regressions in C and D were calculated only from fractions within the peak limits from replicates performed with benzonase (fractions 26–36).

