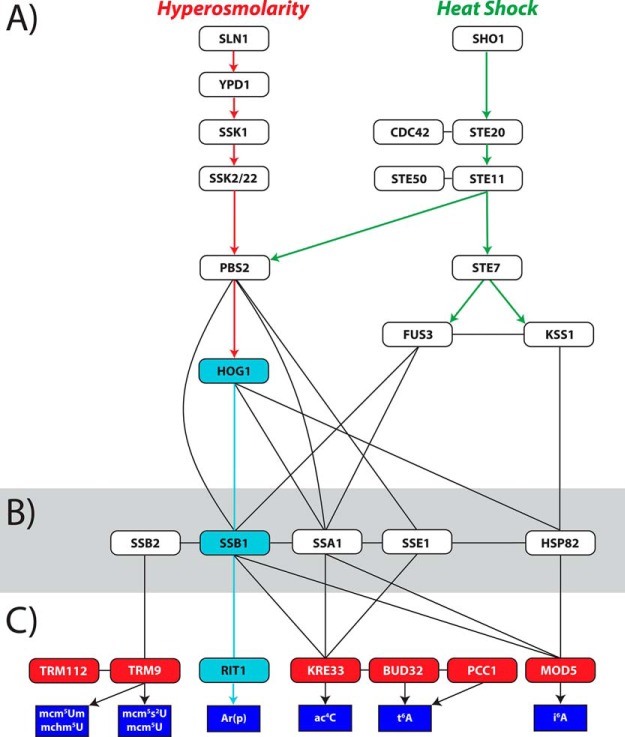
Scheme 2.
A, Established relationships between genes involved in response to hyperosmotic stress and heat shock. B, Putative interactomic network connecting established stress-response genes with PTM biogenetic enzymes. C, Known biogenetic enzymes (red boxes) for selected PTMs of interest (blue). Arrows indicate proven functional relationships. Vertical lines indicate possible functional links. Horizontal lines indicate possible co-expression. Light blue arrows and boxes identify the HOG1 → SSB1 → RIT1 pathway corroborated by gene deletion.

