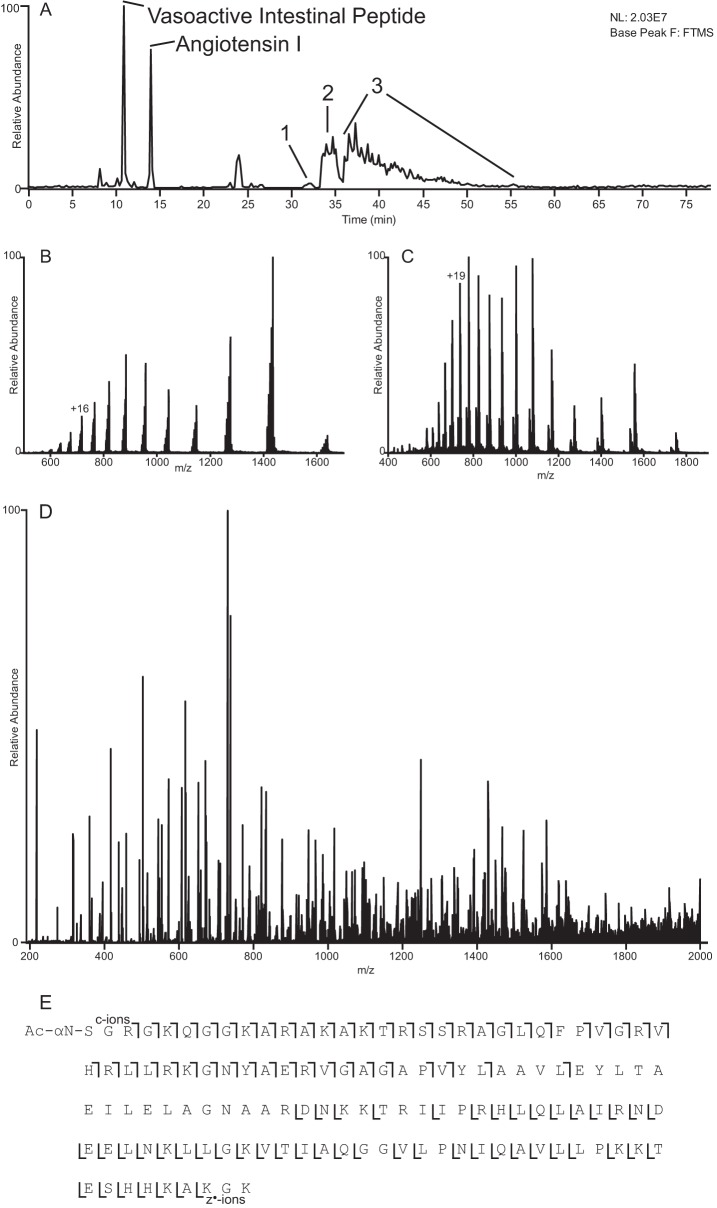
Fig. 2.
Example data obtained from a single LC-MS experiment. A, base peak chromatogram obtained from LC-MS analysis of histone fraction H2A2. Peaks corresponding to 100 fmol of co-loaded peptide standards are labeled, and regions of intact protein elution are numbered. B and C, averaged ESI full MS spectra depicting the charge state distributions of intact H4 and H2A, respectively (peaks 2 and 3 from A, respectively). D, ETD/IIPT spectrum recorded on [M + 19H]19+ ions from H2A type 1 (P0C0S8) using 4-ms ETD and 25-ms IIPT. Precursor m/z 738.0, 3 μscans, 15 multiple-fills, r = 30,000, average of 6 spectra, 11.7-s elapsed scan time/spectrum (∼19.8 s for single fill/transient equivalent spectrum). E, sequence coverage obtained from MS/MS spectrum shown in D.

