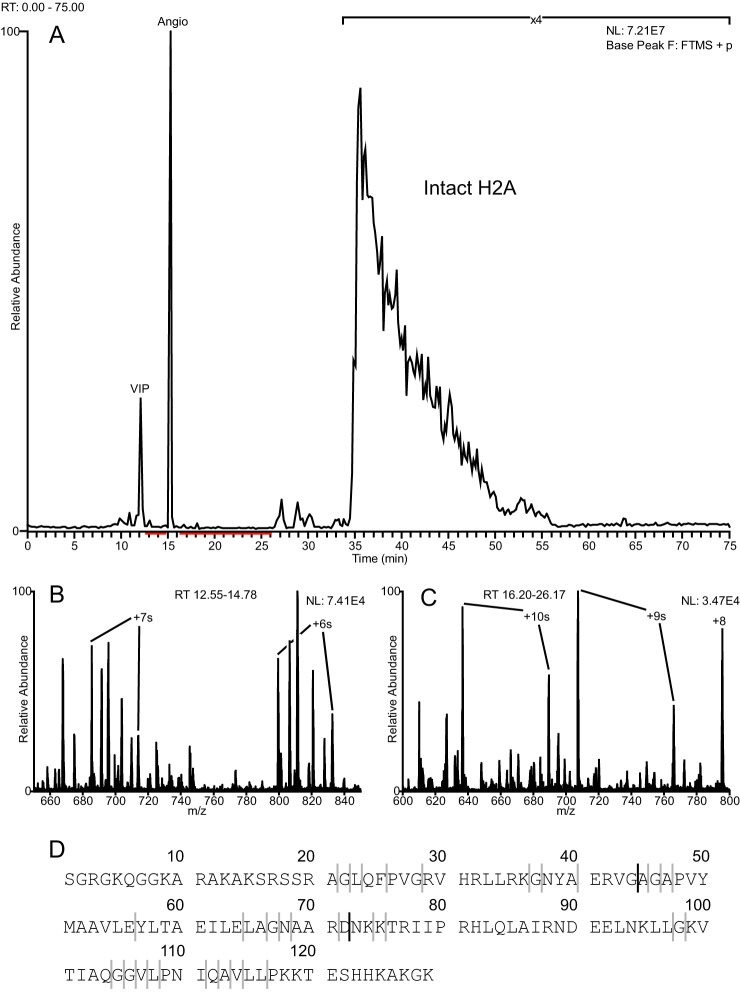
Fig. 7.
Fraction H2A1 contains truncated H2A proteoforms. Inspection of the total ion chromatogram and full MS spectra revealed the presence of several peptidic species in a wide range of sizes. A, base peak chromatogram from LC-MS analysis of fraction H2A1. B and C, ESI full MS spectra averaged over the time periods indicated in red from A. Highly charged peptidic species are observed. D, sequence of the most abundant and intact H2A isoform contained within the fraction (H2A.2-A, Q6FI13). Solid bold lines indicate primary cleavage sites mapped by MS. The gray lines indicate additional less abundant cleavage sites.

