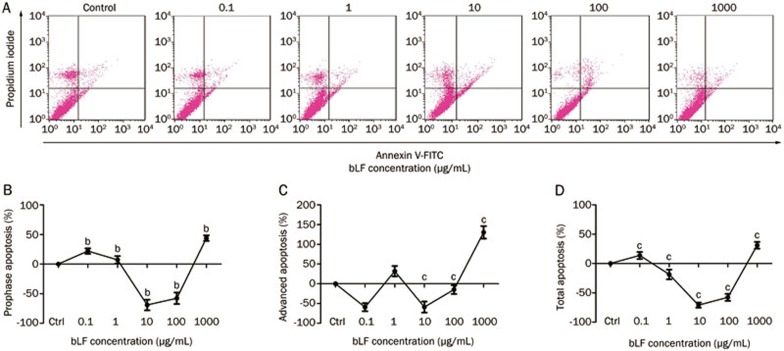
Figure 2.
The rate of apoptosis in the different apoptotic phases in response to treatment with varying concentrations of bLF for 24 h. (A) The rate of prophase apoptosis. (B) The rate of advanced apoptosis. (C) The rate of total apoptosis. bP<0.05, cP<0.01 compared to the control group. Each experiment was performed in triplicate.

