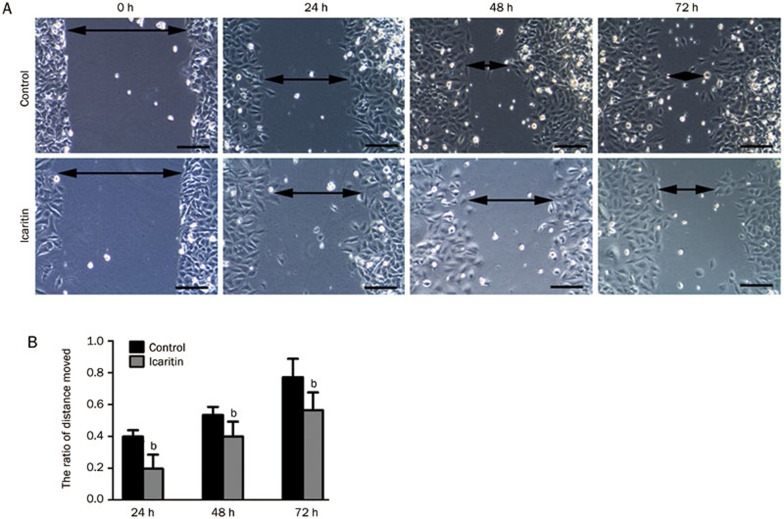
Figure 2.
(A) Scratch assays to determine the motility of SaOS2 cells. Double headed arrows indicate the wound edges. The cells treated with icaritin showed a decreased motility compared to the control group at the different time points (24, 48, and 72 h). (B) Representative graphical representation of the average distance moved in the icaritin-treated and control groups. n=3. Mean±SD. bP<0.05, compared to the control group. Scale bars=10 μm.

