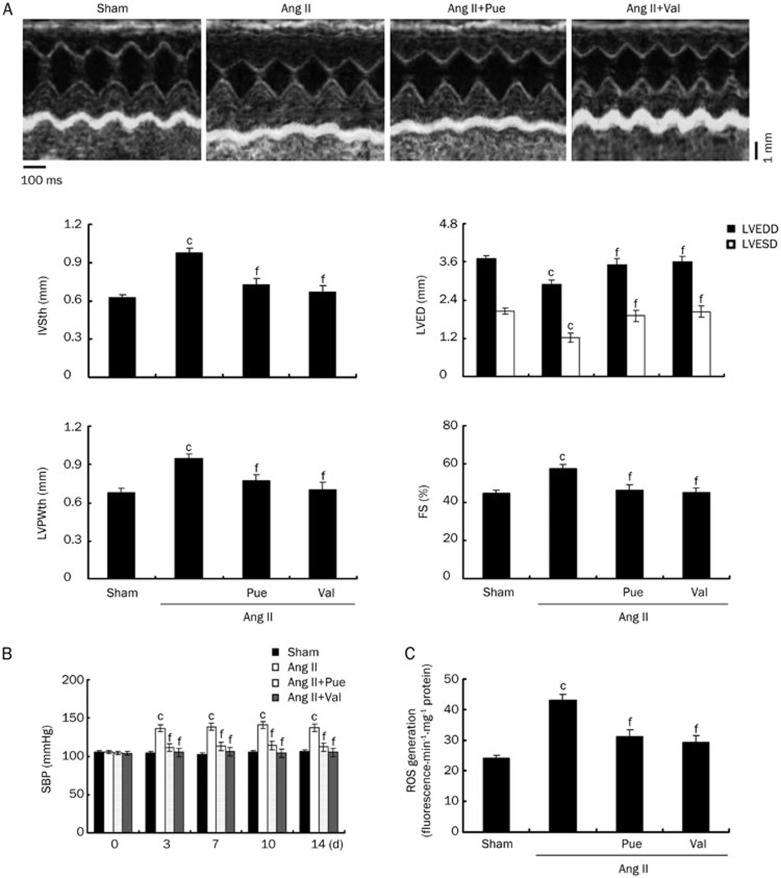
Figure 2.
Noninvasive assessment of cardiac hypertrophy and SBP and measurements of ROS production in vivo. (A) Representative M-mode images of cardiac hypertrophy assessed by echocardiography after 15 d of Ang II infusion. (B) Change in the SBP during Ang II-perfusion in mice. (C) Measurements of ROS production induced by Ang II in the left ventricle homogenates. Mean±SEM. n=3. cP<0.01 vs sham group. fP<0.01 vs Ang II-infused group.

