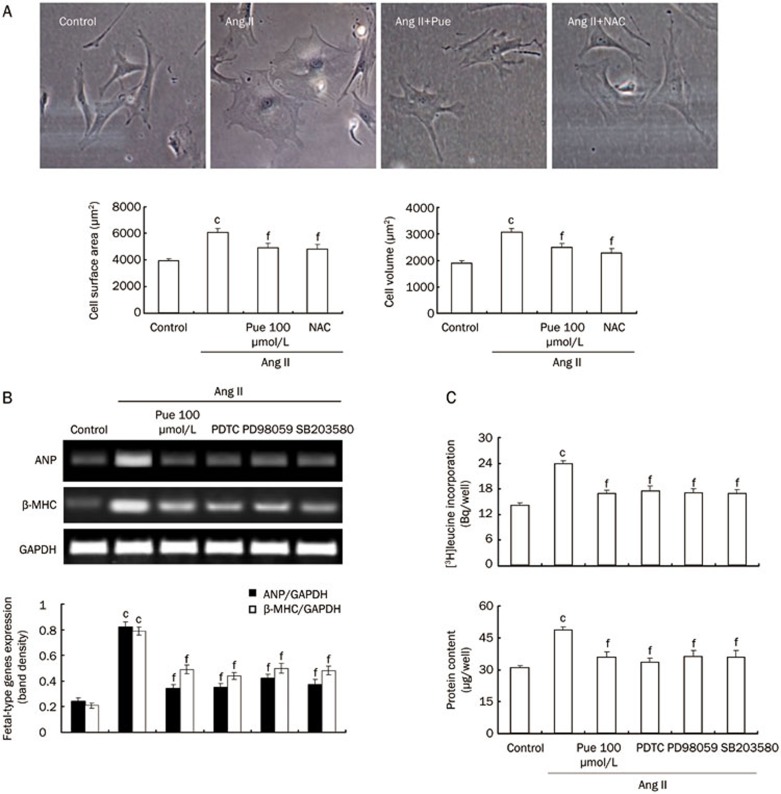
Figure 8.
Effect of Pue on the Ang II-induced hypertrophic response in cultured cardiomyocytes. (A) Representative images of cultured cardiomyocytes (original magnification ×400). The bar graph shows the quantified cardiomyocyte surface area and volume. (B) Expression of fetal-type genes in the cardiomyocytes. (C) The rate of protein synthesis and the total protein content in the cardiomyocytes. Mean±SEM. n=3. cP<0.01 vs control group. fP<0.01 vs Ang II-treated group.

