
Table I.
Summary of oligosaccharide analysis of the rhATs produced by CHO cells
| Samplesa | Relative composition of monosaccharides |
Structured | ||||
|---|---|---|---|---|---|---|
| Fucose | GlcNAcb | Mannose | Galactose | Sialic acidc | ||
| phAT | 0.03 | 4.0 | 2.3 | 1.9 | 2.0 | |
| rhAT-Manα | n.d. | 2.0 | 5.3 | n.d. | n.d. | I |
| rhAT-Manβ | n.d. | 2.0 | 5.4 | n.d. | n.d. | I |
| rhAT-Comα | n.d. | 4.0 | 1.9 | 2.1 | 2.3 | II, III |
| rhAT-Comβ | n.d. | 4.0 | 2.2 | 1.8 | 1.8 | II, III |
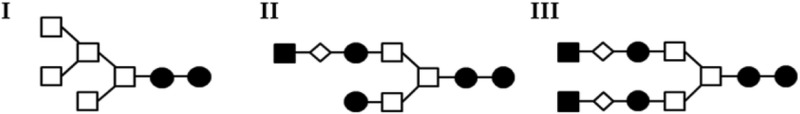
Sialic acid (closed square), galactose (open diamond), GlcNAc (closed circle) and mannose (open square).
n.d., not detected.
aThe purified phAT, rhAT-Manα, rhAT-Manβ, rhAT-Comα and rhAT-Comβ were employed as samples.
bMolar ratios calculated versus GlcNAc composition.
cMol sugar/oligosaccharide chain.
dSchematic of the major oligosaccharide structures detected by MALDI-TOF MS are described above.