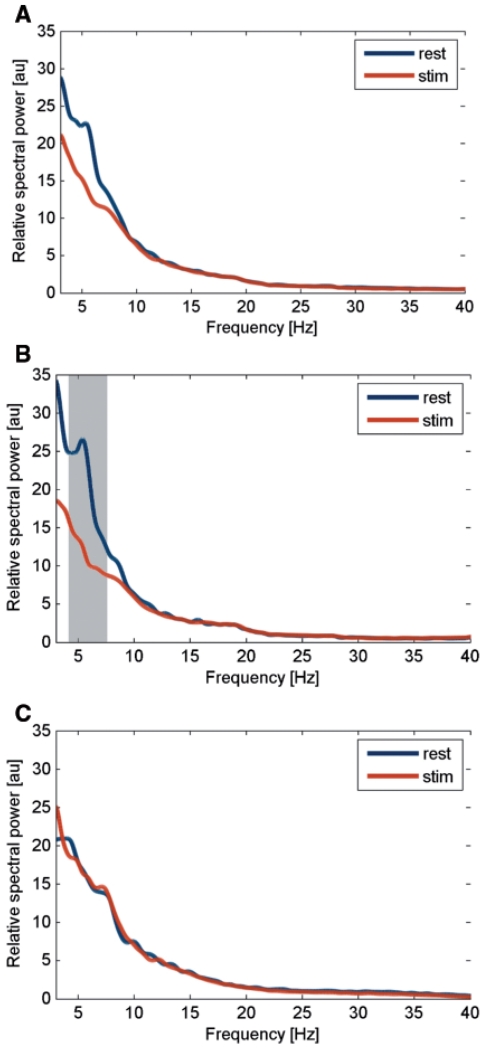
Figure 4.
Mean relative spectral power during rest condition (blue line) and stimulation (red line) for the overall data (A), the phasic (B) and tonic (C) group. The grey shaded area denotes a significant difference between conditions using Wilcoxon’s sign rank test for 0.5 Hz bins (with at least four consecutive bins at P < 0.05). Note that only the group of patients with predominant phasic dystonia showed a suppression of low frequency activity that was significant for the frequency range from 4.4–7.3 Hz.

