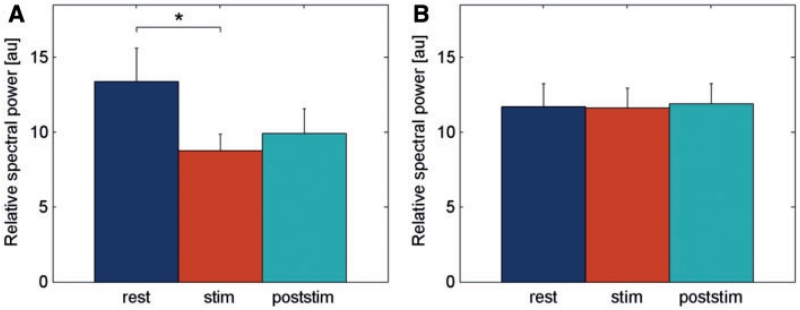
Figure 5.
Post hoc analysis of the group × condition interaction of LFP power changes. The bar chart shows the mean normalized 4–12 Hz activity before HFS (‘rest’), during HFS (‘stim’), and after cessation of HFS (‘poststim’) in the phasic (A) and tonic (B) subgroup of patients. Note that 4–12 Hz activity was significantly suppressed during HFS in the subgroup of patients with predominant phasic dystonic movements.

