Abstract
Colorectal cancer (CRC) incidence rates and mortality have been decreasing in the United States. Currently, states in the South have the smallest reduction in CRC mortality. The trends of CRC incidence rates in Georgia in comparison to the United States have not been investigated. We analyzed age-adjusted incidence rates of CRC in Georgia and the United States from 2000 to 2012 using data from SEER 18 registries. Age-adjusted incidence rates (95% CI) were calculated as cases per 100,000 to the 2000 US Standard population. CRC incidence rates were calculated for groupings based on age at time of diagnosis, race, sex, and geographic location within Georgia. Incidence rates were higher in males compared to females in Georgia. In Georgians age 50–64, incidence rates were higher compared to the US, while those ages 65+ displayed lower incidence rates. Black Georgians age 50–64 generally exhibited higher incidence rates of CRC and lower rates of decrease in incidence compared to other races in Georgia. Asian/Pacific Islander females age 50–64 in Georgia exhibited an increasing trend in incidence rate. Whites and blacks Georgians age 50–64 displayed higher incidence rates compared to the US, while Asian/Pacific Islanders displayed lower incidence rates. Greater incidence rates of CRC in rural and Greater Georgia were seen across all races when compared to overall rates in Georgia. Efforts should be made to address disparities in Georgia based on race and geographic location. Increased screening by colonoscopy or fecal occult blood testing, reduction of risk factors and promotion of healthy lifestyles can reduce CRC incidence rates.
Keywords: Colorectal cancer, age-adjusted incidence rates, Public health, SEER, Age and race disparity
INTRODUCTION
Colorectal cancer (CRC) is a major public health concerns in the United States (US), with estimates of 132,700 new cases and 49,700 deaths occurring in 2015 [1]. Development of CRC is a slow process, with early stages often presenting with no symptoms. Most CRCs are adenocarcinomas arising from non-cancerous adenomatous polyps. Overall, incidence rates of CRC have decreased since the mid-1980s, a trend that can be explained by the increase in CRC screening and removal of precancerous polyps. CRC screening includes the use of fecal occult blood testing (FOBT), flexible sigmoidoscopy, or colonoscopy. Current research is focused on DNA testing and searching for a genetic basis for CRC [1,2].
Various risk factors for CRC have been identified, and these form the basis for screening recommendations. CRC, like most other kinds of cancer, demonstrates an increase in incidence with age. In addition, having a family history of CRC increases the risk of developing this cancer. A medical history of adenomatous polyps, chronic inflammatory bowel disease (IBD), and/or diabetes along with other chronic metabolic disorders such as obesity, increases the risk for CRC. Implicated in CRC incidence are modifiable behavioral factors including alcohol consumption (2–4 drinks per day increases risk), obesity, lack of physical activity, consumption of red and processed meats, lack of dietary fiber, and smoking [3]. In addition, CRC incidence rates are currently highest among black men and women and lowest among Asian/Pacific Islander men and women, and in general, are higher for men compared to women [3,4].
Currently, substantial data exist regarding cancer incidence rates throughout the country, including data on CRC. However, even though there have been a few studies on cancer incidence, CRC incidence rates in Georgia have not been investigated [5,6]. Georgia, with an African-American population of close to 3 million, which is one of the highest in the country, thus has a large number of people at increased risk for CRC [7]. An aim was to identify trends in CRC incidence rates in Georgia compared to the US to understand how health policy in Georgia regarding CRC may need to be modified. An addition aim was to find differences in CRC incidence rates in Georgia based on age, race, and gender to identify groups that may need to be targeted for health policies related to CRC awareness and screening. A final aim was to recognize differences in CRC incidence rates based on geographic location and to identify areas in Georgia where healthcare workers, public health officials, and community leaders can focus on reducing the impact of CRC. The overall aim was to create a comprehensive overview of CRC in Georgia to understand how to reduce incidence rates and enhance favorable outcomes.
MATERIALS AND METHODS
Data on incidence rates of CRC were obtained from the Surveillance, Epidemiology, and End Results (SEER) program supported by the National Cancer Institute [8]. Specifically, data were obtained from SEER 18, which comprised incidence data collected from 2000 to 2012 at 18 different registries across the US. Although SEER 18 had the shortest time period of collection compared to other registries like SEER 9, SEER 18 is the most comprehensive with regards to range of data. In particular, SEER 18 incorporated data collected by the Georgia Center for Cancer Statistics from three distinct geographic areas in Georgia: Atlanta, Greater Georgia, and Rural Georgia. Atlanta, with the longest running registry, includes Clayton, Cobb, DeKalb, Fulton, and Gwinnett counties. Rural Georgia includes Glascock, Greene, Hancock, Jasper, Jefferson, Morgan, Putnam, Taliaferro, Warren, and Washington counties. Greater Georgia includes all remaining counties in Georgia. Georgia the only state to have several different registries provides a unique opportunity to observe trends in incidence rates of cancers based on geographic location.
Data from SEER 18 were analyzed by use of SEER*Stat 8.2.1 software. Age-adjusted incidence rates of CRC as cases per 100,000 were calculated based on the 2000 US Standard Population using 19 age groups [9,10]. Variables included age at diagnosis (Age < 50, Age 50–64, Age > 65, Age ≥ 50, All Age Groups), year of diagnosis (2000–2012), race (White, Black, Asian/Pacific Islander, All Races), sex (Male, Female, All Sexes), geographic location (US, Georgia, Atlanta Metro, Greater Georgia, Rural Georgia), and site/morphology (ICD-O-3/WHO 2008 Colon and Rectum: C180, C181, C182-C189, C199, C209). A 95% confidence interval was selected [11].
On the basis of populations created from combinations of the aforementioned age at diagnosis, race, sex, and location variables, incidence rates of CRC were obtained for each year from 2000 to 2012. Using this data, trend lines were created for comparative purposes. Furthermore, annual percent changes (APC) and 95% confidence intervals were calculated using the weighted least square method. In addition, average incidence rates over the 2000–2012 periods were calculated for comparisons based on race, sex, and geographic location. Groups that had an incidence rate of zero were not excluded. Analysis for outliers was not conducted.
RESULTS
For populations in Georgia and the US, age and race groups, trends of age-adjusted incidence rates of CRC were examined based on SEER 18 data collected from 2000 to 2012 (Table 1). Overall, the incidence rates of CRC decreased for SEER 18 data (54.4 in 2000 and 39.7 in 2012) with significant annual percent changes (APC=−2.6, 95% CI=[−2.9,−2.4]). The decrease in APC for incidence rates in Georgia (APC=−2.3) was lower than USA (APC=2.6). It’s interesting to see that age-groups greater than 50 showed decrease APCs (APC=−1.6 for 50 to 50 group and APC=−3.6 for >65 group) but the APC of youngest group (<50) revelry increased (APC=1.5, 95% CI= [1.3, 1.7]). All race groups showed a decreased APC (APC=−2.8 for white, APC=−2.3 for black, and APC=−2.3 for API).Overall, for patients aged 50 or more, CRC incidence rates have been decreasing in the US and Georgia at a similar pace. Incidence rates in Georgia were similar to incidence rates in the US, with males displaying a higher rate relative to females (Figure 1).
Table 1.
Crude and age-adjusted incidence rates and annual percent changes of colorectal cancer for region (Georgia, US), age-groups (<50, 50–64,>65), and race group (white, black, Asian and pacific islanders) by year.
| Year | Region | Age-Group | Race Group | |||||||||||||
|---|---|---|---|---|---|---|---|---|---|---|---|---|---|---|---|---|
| US | GA | <50 | 50–64 | >65 | White | Black | API | |||||||||
| Crud | adj | Crud | adj | Crud | adj | Crud | adj | Crud | adj | Crud | adj | Crud | adj | Crud | adj | |
| 2000 | 49.8 | 54.4 | 43.3 | 52.5 | 5.7 | 5.9 | 82.2 | 83.0 | 297.8 | 298.3 | 53.2 | 54.2 | 42.1 | 63.9 | 33.2 | 43.6 |
| 2001 | 49.6 | 53.8 | 42.3 | 51.2 | 5.8 | 5.9 | 81.7 | 82.7 | 294.0 | 293.8 | 52.6 | 53.3 | 42.6 | 64.1 | 34.5 | 45.1 |
| 2002 | 49.2 | 52.9 | 44.2 | 53.0 | 5.9 | 6.0 | 81.8 | 82.3 | 287.6 | 286.7 | 52.1 | 52.3 | 42.8 | 63.1 | 35.8 | 45.6 |
| 2003 | 48.3 | 51.4 | 43.2 | 51.1 | 6.0 | 6.0 | 79.2 | 79.4 | 279.1 | 278.0 | 51.0 | 50.8 | 43.7 | 63.6 | 33.0 | 41.5 |
| 2004 | 47.1 | 49.7 | 44.3 | 51.7 | 6.2 | 6.2 | 78.4 | 78.4 | 265.4 | 264.2 | 49.7 | 49.0 | 42.8 | 61.4 | 33.0 | 40.6 |
| 2005 | 46.7 | 48.6 | 41.9 | 47.8 | 6.3 | 6.3 | 78.7 | 78.6 | 256.6 | 255.1 | 49.2 | 48.1 | 42.5 | 59.4 | 33.6 | 40.0 |
| 2006 | 46.2 | 47.6 | 42.8 | 48.2 | 6.4 | 6.5 | 75.7 | 75.6 | 251.0 | 249.8 | 48.4 | 46.8 | 43.1 | 59.4 | 33.5 | 39.5 |
| 2007 | 46.3 | 47.0 | 43.0 | 47.5 | 6.5 | 6.6 | 77.9 | 77.2 | 243.1 | 242.4 | 48.3 | 46.1 | 44.0 | 58.7 | 34.4 | 39.6 |
| 2008 | 45.7 | 45.9 | 40.6 | 44.0 | 6.5 | 6.6 | 75.1 | 74.4 | 236.9 | 237.2 | 48.0 | 45.2 | 42.1 | 55.9 | 34.4 | 38.7 |
| 2009 | 44.6 | 44.2 | 40.4 | 43.5 | 6.7 | 6.8 | 75.0 | 74.1 | 221.6 | 222.6 | 46.4 | 43.2 | 42.7 | 55.2 | 34.3 | 37.6 |
| 2010 | 43.1 | 42.0 | 39.2 | 42.8 | 6.7 | 6.8 | 72.8 | 72.4 | 206.5 | 207.7 | 44.7 | 41.0 | 41.4 | 52.4 | 33.5 | 36.3 |
| 2011 | 42.3 | 40.7 | 40.3 | 41.7 | 6.7 | 6.9 | 70.6 | 69.3 | 198.0 | 199.7 | 43.7 | 39.6 | 40.4 | 49.9 | 33.7 | 35.6 |
| 2012 | 42.0 | 39.7 | 41.1 | 41.5 | 6.7 | 6.9 | 70.4 | 69.5 | 189.3 | 192.3 | 43.5 | 38.9 | 40.4 | 49.0 | 31.8 | 32.9 |
| APC | 2.6* | 2.3* | 1.5* | 1.6* | −3.6* | 2.8* | 2.3* | 2.3* | ||||||||
p-value< 0.05 (Statistically significant change from 0)
Abbreviations: APC: Annual Percent Change; API: Asian and Pacific Islanders; Crud: Crude Incidence Rates; adj: Age-Adjusted Incidence Rates
Figure 1.
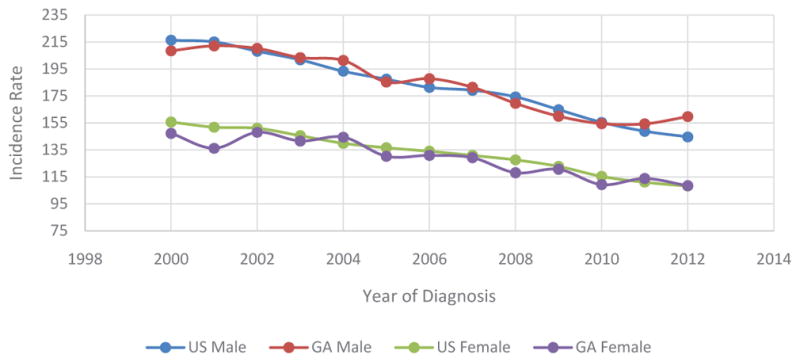
Trends of Age-Adjusted Incidence Rates of CRC Based on Sex in US and Georgia, 2000 – 2012.
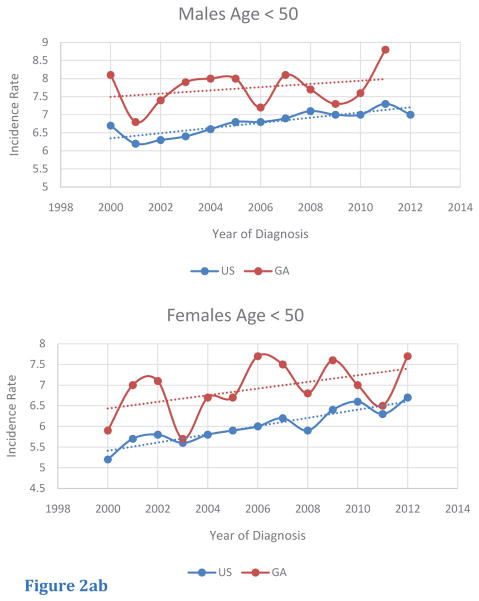
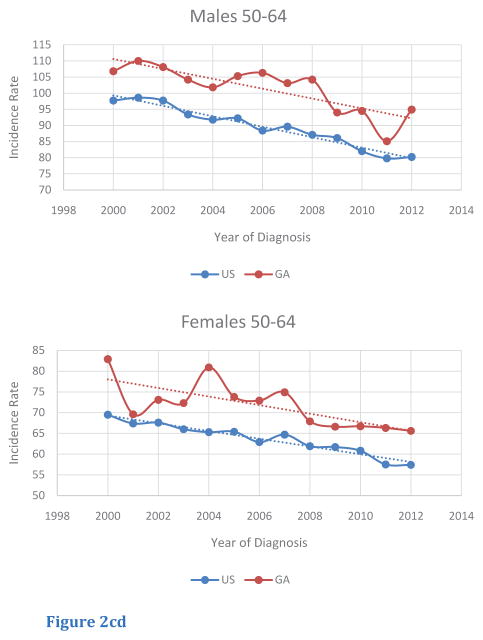
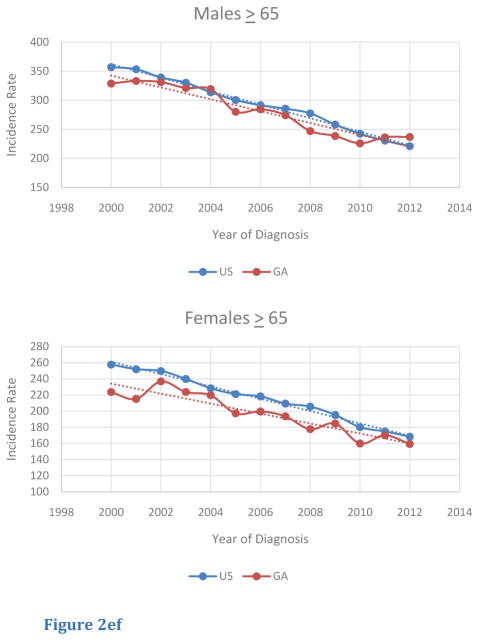
Among age-specific subgroups, trends of age-adjusted incidence rates of CRC were also investigated (Table 2). For this query, age-segments included less than 50 (< 50), from 50 to 64 (50 – 64), and greater than or equal to 65 (> 65). Although the < 50 age-segment had a lower magnitude of incidence rate compared to the other age segments, this age-segment was the only group to display an increasing trend in CRC incidence in both male and female populations in the US and in Georgia. Furthermore, in Georgia, incidence rates in Georgia in the < 50 age-segment were greater compared to those of the US (Figure 2A, B). For the 50— 64 age segment, CRC incidence rates were higher for male and female Georgians, compared to rates in for the US. In addition, CRC incidence rates within the 50–64 age segments decreased from 2000 to 2012, with similar rates of change in rates for both Georgians and within the US (Figure 2C, D). The > 65 age segment had the highest absolute incidence rate of all the age segments. In contrast to rates for the < 50 and the 50 – 64 age segments, Georgians in this age segment exhibited lower CRC incidence rates compared to those for the US. Once again, a similar trend in the rate of decrease in CRC incidence from 2000 to 2012 was seen for both sexes in both Georgia and the US (Figure 2E, F).
Table 2.
Age-adjusted incidence rates and annual percent changes of colorectal cancer by year stratified by region, age group, and gender.
| Year | USA | GA | ||||||||||
|---|---|---|---|---|---|---|---|---|---|---|---|---|
| <50 | 50–64 | ≥65 | <50 | 50–64 | ≥65 | |||||||
| M | F | M | F | M | F | M | F | M | F | M | F | |
| 2000 | 6.7 | 5.2 | 97.7 | 69.5 | 357 | 257.7 | 8.1 | 5.9 | 106.8 | 82.9 | 328.8 | 223.7 |
| 2001 | 6.2 | 5.7 | 98.6 | 67.4 | 353.4 | 252 | 6.8 | 7 | 110 | 69.6 | 333.2 | 215.2 |
| 2002 | 6.3 | 5.8 | 97.7 | 67.6 | 339.3 | 249.8 | 7.4 | 7.1 | 108.1 | 73.1 | 331.3 | 236.9 |
| 2003 | 6.4 | 5.6 | 93.4 | 66 | 330.4 | 239.9 | 7.9 | 5.7 | 104.2 | 72.3 | 321.1 | 223.8 |
| 2004 | 6.6 | 5.8 | 91.8 | 65.3 | 313.8 | 228.4 | 8 | 6.7 | 101.8 | 80.9 | 319.3 | 219.7 |
| 2005 | 6.8 | 5.9 | 92.2 | 65.4 | 300.4 | 221.1 | 8 | 6.7 | 105.3 | 73.8 | 280.2 | 197.3 |
| 2006 | 6.8 | 6 | 88.4 | 62.9 | 291.6 | 218.3 | 7.2 | 7.7 | 106.3 | 72.9 | 284.5 | 199.7 |
| 2007 | 6.9 | 6.2 | 89.6 | 64.7 | 285.6 | 209.4 | 8.1 | 7.5 | 103.1 | 74.9 | 274.3 | 193.6 |
| 2008 | 7.1 | 5.9 | 87.1 | 61.9 | 277.6 | 205.6 | 7.7 | 6.8 | 104.2 | 67.9 | 247 | 177.7 |
| 2009 | 7 | 6.4 | 86.1 | 61.7 | 258.2 | 195.3 | 7.3 | 7.6 | 94 | 66.6 | 238.4 | 184.7 |
| 2010 | 7 | 6.6 | 82 | 60.8 | 242.4 | 180.1 | 7.6 | 7 | 94.5 | 66.7 | 225.7 | 159.9 |
| 2011 | 7.3 | 6.3 | 79.8 | 57.5 | 230.6 | 174.8 | 8.8 | 6.5 | 85.1 | 66.3 | 236.3 | 170.2 |
| 2012 | 7 | 6.7 | 80.2 | 57.4 | 221 | 168.4 | 6.5 | 7.7 | 94.9 | 65.6 | 236.7 | 159.3 |
| APC | 1.1* | 1.7* | −1.8* | −1.5* | −4.0* | −3.5* | −0.1 | 1.1 | −1.5* | −1.5* | −3.6* | −3.1* |
p-value < 0.05 (Statistically significant change from 0)
Abbreviations: APC: Annual Percent Change
Figure 2.
Figure 2abTrends of Age-Adjusted Incidence Rate of CRC in < 50 in US and Georgia, 2000 – 2012 for (A) male and (b) female.
Figure 2cd Trends of Age-Adjusted Incidence Rate of CRC in 50–64 in US and Georgia, 2000 – 2012 for (C) male and (D) female.
Figure 2ef Trends of Age-Adjusted Incidence Rate of CRC in 65 in US and Georgia, 2000 – 2012 for (E) male and (F) female.
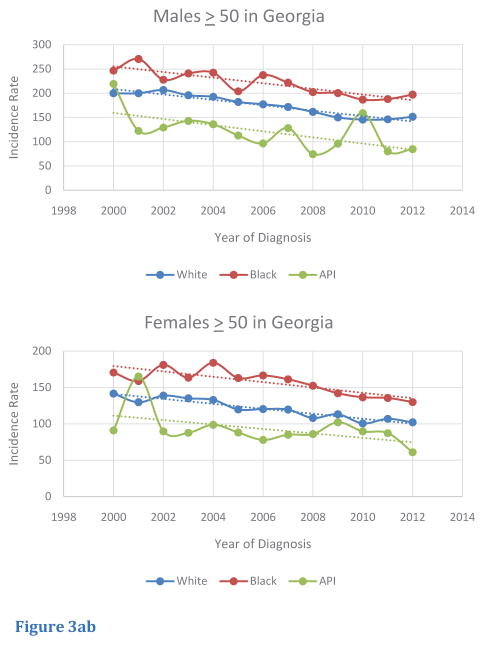
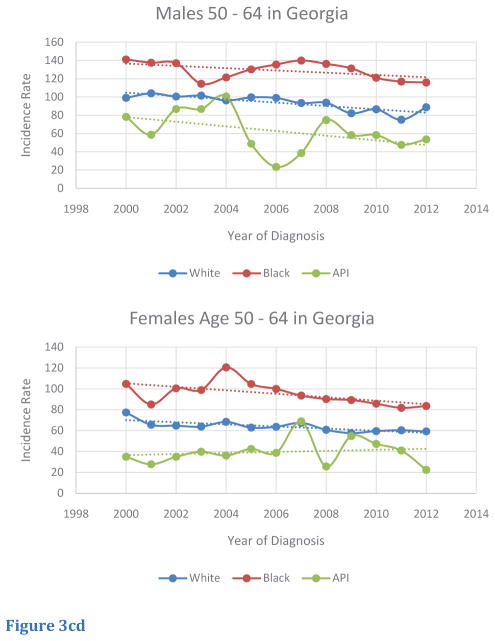
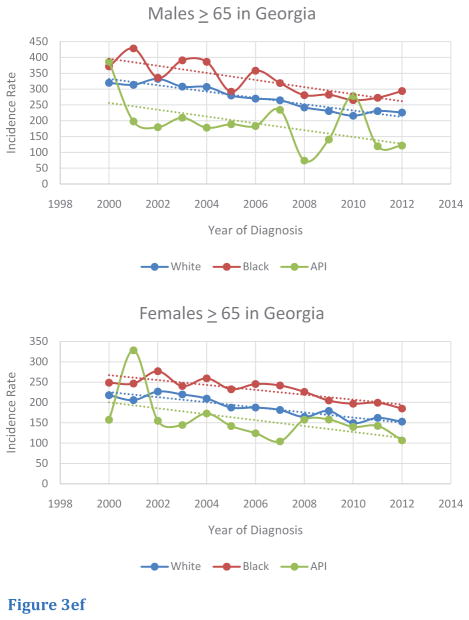
Trends of age-adjusted CRC incidence rates in the Georgia population for race-specific subgroups were also investigated (Table 3). Overall, incidence rates for white, black, and Asian/Pacific Islander Georgians over 50 decreased from 2000 to 2012. Although incidence rates decreased for black males and females from 2000 to 2012, these two groups exhibited higher rates compared to other races in Georgia, with exceptions; in CRC incidence rates, Asian/Pacific Islanders males in 2010 and Asian/Pacific Islander females in 2001 eclipsed other races (Figure 3A,B). Within the 50 – 64 age segment in Georgia, several trends were noted. Although incidence rates decreased over the 2000 to 2012 period for males, black males had the lowest rate of decrease in incidence, and Asian/Pacific Islander males had the greatest rate of decrease. In contrast, black females in this age segment in Georgia had the greatest rate of decrease in incidence, but Asian/Pacific Islander females had an increasing trend in incidence. Relative to other races, black males and females in this age-segment continually demonstrated higher rates of incidence from 2000 to 2012 (Figure 3C,D). Within the > 65 age segment, black males and females generally exhibited higher rates of incidence from 2000 to 2012 relative to other races. However, several exceptions were noted: Asian/Pacific Islander males exhibited the highest rates in 2000 and 2010, and Asian/Pacific Islander females exhibited the highest rates in 2001. Incidence rates for all races and sexes in the > 65 age segment experienced a downward trend from 2000 to 2012, although absolute rates of incidence remained higher in this age-segment compared to people in the < 50 and 50–64 age segments (Figure 3E,F).
Table 3.
Age-adjusted incidence rates and annual percent changes of colorectal cancer by age-groups stratified by gender and race groups.
| Year | ≥ 50 | 50–64 | > 65 | |||||||||||||||
|---|---|---|---|---|---|---|---|---|---|---|---|---|---|---|---|---|---|---|
| M | F | M | F | M | F | |||||||||||||
| W | B | API | W | B | API | W | B | API | W | B | API | W | B | API | W | B | API | |
| 2000 | 199.9 | 246.5 | 219.2 | 141.7 | 170.6 | 91 | 99.1 | 141.1 | 78.2 | 77.4 | 104.8 | 35 | 319.6 | 371.6 | 386.5 | 218 | 248.7 | 157.4 |
| 2001 | 199.9 | 270.6 | 122.3 | 129.8 | 158.9 | 165.2 | 104.1 | 137.5 | 58.7 | 65.7 | 85.1 | 27.8 | 313.6 | 428.5 | 197.8 | 205.9 | 246.6 | 328.3 |
| 2002 | 206.5 | 227.9 | 129.2 | 138.9 | 181.1 | 89.8 | 100.5 | 137 | 86.8 | 64.8 | 100.5 | 34.9 | 332.2 | 335.7 | 179.5 | 226.9 | 276.8 | 154.9 |
| 2003 | 195.8 | 240.9 | 142.9 | 135.2 | 163.6 | 87.7 | 101.5 | 114.4 | 86.8 | 63.9 | 98.9 | 39.8 | 307.6 | 390.9 | 209.4 | 219.8 | 240.4 | 144.6 |
| 2004 | 192.5 | 242.4 | 135.9 | 133 | 184 | 98.7 | 96.2 | 121.4 | 100.6 | 68.4 | 120.6 | 36.1 | 306.8 | 386 | 177.8 | 209.7 | 259.3 | 172.9 |
| 2005 | 181.9 | 204 | 112.8 | 119.9 | 163.1 | 88.1 | 99.6 | 130.2 | 48.8 | 62.9 | 104.7 | 42.5 | 279.4 | 291.5 | 188.8 | 187.5 | 232.4 | 142.1 |
| 2006 | 177.2 | 237.3 | 96.5 | 120.4 | 166.5 | 77.9 | 99 | 135.5 | 23.4 | 63.7 | 100 | 38.7 | 270 | 358.1 | 183.2 | 187.6 | 245.3 | 124.5 |
| 2007 | 171.7 | 221.8 | 128.1 | 119.7 | 161.3 | 85.1 | 93.4 | 139.9 | 38.5 | 67.5 | 93.6 | 68.9 | 264.6 | 319 | 234.3 | 181.7 | 241.8 | 104.2 |
| 2008 | 161.5 | 202.3 | 74.3 | 108.2 | 152.4 | 86 | 93.7 | 136.2 | 74.7 | 60.8 | 90.3 | 25.6 | 241.9 | 280.7 | 73.8 | 164.6 | 226.2 | 157.6 |
| 2009 | 150 | 200.3 | 95.9 | 113.3 | 142.1 | 102.2 | 82.2 | 131.3 | 58.3 | 57.7 | 89.3 | 54.8 | 230.4 | 282.2 | 140.6 | 179.3 | 204.8 | 158.3 |
| 2010 | 145.5 | 186.9 | 158.9 | 100.7 | 136.6 | 89.7 | 86.5 | 121 | 58.3 | 59.6 | 85.8 | 47.3 | 215.6 | 265.1 | 278.2 | 149.5 | 196.9 | 140 |
| 2011 | 146.1 | 188 | 80.3 | 106.9 | 135.6 | 87.3 | 75.1 | 116.8 | 47.6 | 60.4 | 81.9 | 41 | 230.4 | 272.6 | 119.1 | 162.2 | 199.3 | 142.4 |
| 2012 | 151.4 | 197.2 | 84.6 | 102.1 | 130 | 61 | 88.7 | 115.9 | 53.6 | 59.3 | 83.6 | 22.4 | 225.7 | 293.7 | 121.5 | 152.8 | 185.1 | 106.7 |
| APC | −3.2* | −2.6* | −4.4 | −2.8* | −2.5* | −3.1* | −2.0* | −1.1 | −4 | 1.6* | −2.0* | 0.8 | −3.6* | −3.3* | −4.3 | −3.3* | −2.7* | −4.4* |
p-value< 0.05 (Statistically significant change from 0)
Abbreviations: APC: Annual Percent Change
Figure 3.
Figure 3ab Trends of Age-Adjusted Incidence Rate of CRC in Races for Age <50 in Georgia, 2000 – 2012 for (A) male and (B) female..
Figure 3cd Trends of Age-Adjusted Incidence Rate of CRC in Races for Age 50–64 in Georgia, 2000 – 2012 for (C) male and (D) female.
Figure 3ef Trends of Age-Adjusted Incidence Rate of CRC in Races for Age ≥65 in Georgia, 2000 – 2012 for (E) male and (F) female..
Based on race and age, differences were noted between the US and Georgia. For adults aged 50–64, white and black Georgia males, on average had higher incidence rates of CRC relative to white and black US males, respectively. However, white and black Georgian females had similar rates of incidence of CRC compared to the US population. In contrast, in Georgia, Asian/Pacific-Islander of both sexes had lower incidence rates of CRC compared to whites and blacks (Figure 4A). Georgians of all races and both sexes in the age segment > 65 of all races and all sexes exhibited lower rates of CRC incidence relative to those of the US (Figure 4B).
Figure 4.
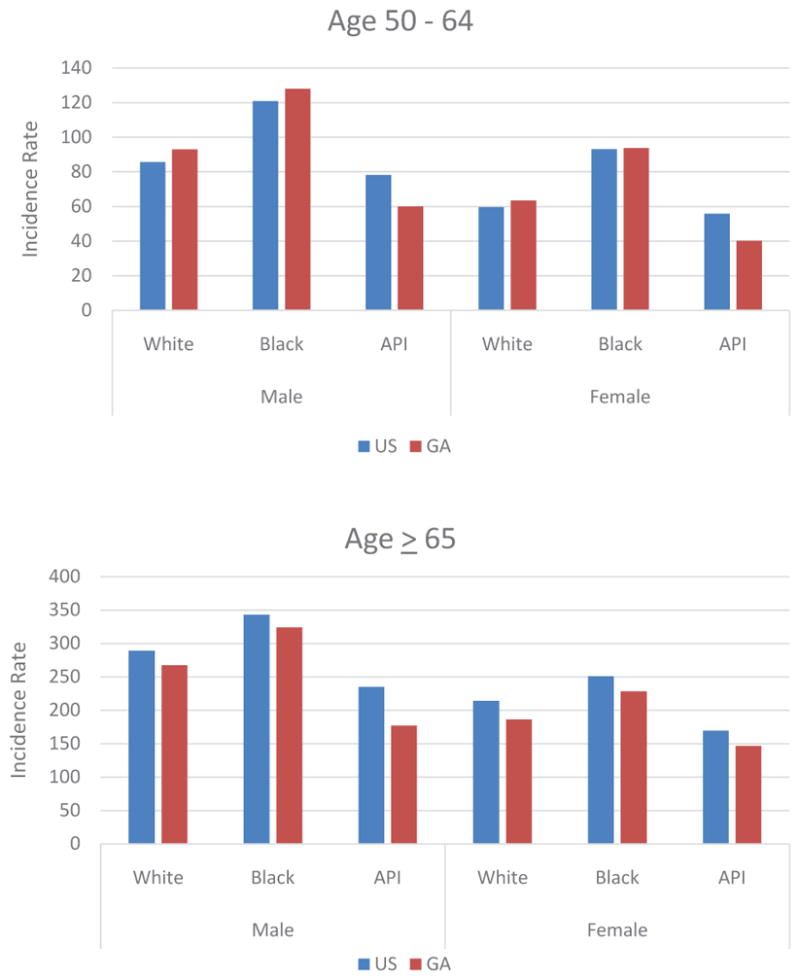
Figure 4ab Comparison of Age-Adjusted Incidence Rate of CRC Based on Race and Gender in US and Georgia in (A) Age 50 – 64 and (B) Age ≥65.
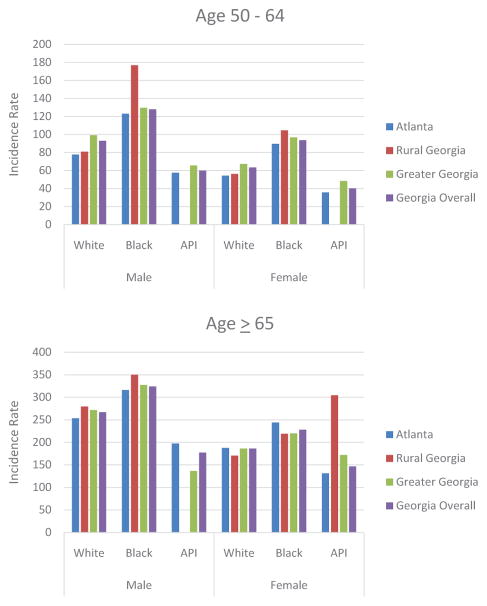
In comparing race groups, geographic location within Georgia affected CRC incidence rates. For the 50 – 64 age segment, black males and females living in rural areas in Georgia had higher rates of CRC incidence when relative to their counterparts in the Atlanta metro area or in the state of Georgia overall. In addition, males and females of all race groups living in Greater Georgia areas had higher rates of CRC incidence relative to those living in the Atlanta metro area and the state of Georgia overall. Males and females of all race groups who lived in the Atlanta metro area exhibited lower incidence rates relative to rates for Georgia overall (Figure 5A). For Georgians in the > 65 age segment, black males, white males, and Asian/Pacific Islander females in rural Georgia had higher incidence rates compared to those in other areas in Georgia. However, the highest rates of incidence for Asian/Pacific Islander males and black females were seen in the Atlanta metro area (Figure 5B). Considering the entire population of Georgia >50 years old, black males in rural Georgia had the highest incidence rates of CRC (not shown here).
Figure 5.
Figure 5abComparison of Age-Adjusted Incidence Rate of CRC Based on Race and Gender in Georgia Regions in (A) Age 50 – 64 and (B) Age ≥65.
DISCUSSION
CRC, like all cancers, is a multi-factorial disease. Multiple risk factors contribute to the potential of an individual to develop CRC. The prevalence of certain risk factors may affect the trends in CRC incidence. Based on the results described previously, we suggest that a combination of trends in lifestyle factors, access to preventative care, and cultural attitudes are responsible for the differences in CRC incidence rates among races, sexes, age-groups, and geographic locations [4].
In general, CRC incidence rates among the US general population and within Georgians are decreasing. This trend is most likely due to increases in CRC screening procedures (fecal occult blood test, flexible sigmoidoscopy, and colonoscopy), with removal of pre-cancerous polyps during colonoscopies in particular. However, incidence rates of CRC in populations under 50 are increasing, which is a currently unexplained trend. Although the absolute incidence rate of CRC in persons under 50 is small relative to the incidence rates for older populations, the trend is of concern. Current clinical guidelines recommend regular screening beginning at age 50; populations with increased risk, such as those with genetic disorders such as familial adenomatous polyposis or hereditary non-polyposis colon cancer or those with a history of IBD, are recommended to begin screening earlier [12]. For both adult s and children, there are increased incidences of IBDs such as ulcerative colitis and Crohn’s disease. IBD increases the risk for CRC generally eight to ten years after diagnosis. With the median age of diagnosis for ulcerative colitis and Crohn’s disease at 34.9 and 29.5 years, respectively, the increasing incidence of IBD can explain the increasing trends in CRC incidence seen in patients under 50 years of age [13,14].
For patients under the age of 65, incidence rates of CRC are greater in Georgia relative to the US. Current rates of obesity in Georgia may be related to this trend. In Georgia, the current rate of adult obesity (30.3%) is higher than the national average and appears to be increasing [15,16]. Excess body weight, which can be classified into either overweight (BMI between 25 and 29.9 kg/m2) or obese (BMI greater than 30 kg/m2), is a positive risk factor for numerous types of cancer, including colon and rectal cancers. Results of meta-analyses of risk ratios per 5 kg/m2 increase in BMI revealed an increased risk-ratio for colon cancer (1.24 in men, 1.09 in women) and an increased risk-ratio for rectal cancer (1.09 in men, 1.02 in women), indicating that men are affected by more by excess body weight when it comes to risk for developing colon cancer [17]. Thus, the increased prevalence of obesity may explain why incidence rates of CRC in Georgia are higher compared to the US among the < 50 age segments and the 50–64 age segments. Although, for the >65 age segment, the incidence rate of CRC in Georgia was generally lower compared to the US, the increased prevalence in Georgia of obesity and obesity-related metabolic disorders causing premature death due to other related diseases or complications apart from CRC may be related to this trend. Thus, the association between obesity and body adiposity with CRC incidence can be implicated in the trends observed for Georgia [18,19].
In regard to the effect of race on CRC incidence rates within Georgia, black males and females within Georgia had, in general, higher rates of CRC compared to Asian/Pacific Islanders and whites within the same age segment. Obesity rates and characteristic eating patterns among southern whites and blacks can account for the disparities in CRC incidence rates between races. As described earlier, Georgia has a severe obesity epidemic. National trends reflect that black males and females have greater rates of overweight and obesity compared to other races, and this trend is evident in Georgia as well [15]. Diet has been implicated in the protection against development of CRC. Consumption of fruits, vegetables, and dietary fiber has been associated with a lower risk for CRC, but consumption of red meat is implicated as a positive risk factor [4]. Black Americans living in the South generally report food consumption consistent with the Southern diet, which includes fried foods and red meat as favorite foods [20]. In addition, meat consumption has raised among men, particularly black men [21]. Reduction in the rates of obesity among black Georgians and promotion of healthier diets consisting of fresh fruits and vegetables with reduction or elimination of red meat consumption can likely lessen the disparities. In addition, screening recommendations may be adjusted to suggest screening procedures be conducted at earlier ages for African American patients who are identified to have multiple lifestyle associated risk factors.
The trends from 2000–2012 associated with black males and females of all ages and Asian/Pacific Islander females of ages 50–64 indicate that these two groups may not be affected as much by the overall decrease in incidence rates of CRC. Possible explanations for this trend include lack of awareness and access to health care, fear of procedures or results, or prohibitive costs for treatment [22]. Although black males and females are generally are at higher risk due to certain risk factors such as obesity and diet, there may be as yet unidentified factors that are negatively affecting Asian/Pacific Islander females, such as increased consumption of Western-style food. Increased awareness campaigns targeted towards within the Asian/Pacific Islander community are suggested.
Assessment of geographic location within Georgia revealed disparities affecting Georgians within Rural and Greater Georgia. In general, areas outside of the Atlanta Metro displayed higher incidence rates compared to the Georgia average. This can be indicative of disparities regarding care and awareness in communities throughout Georgia as well as higher rates of obesity in some counties located in rural and Greater Georgia. Further, Georgia, like many other states, is experiencing a shortage of primary care physicians (PCPs), especially in rural areas [23]. PCPs are essential for general maintenance of patient health, health education and awareness, and ensuring patient access to the health care network. Since many of the risk factors for CRC are preventable, including modifications to diet and other lifestyle factors, they may be managed by adequate primary care services. In addition, PCPs may identify patients who are at risk for CRC and recommend screening procedures at the appropriate times. Finally, PCPs will be able to educate patients about the importance of cancer prevention and cancer screening, and can advocate to their communities. For particular races, black and white males in rural and Greater Georgia and Asian/Pacific Islander and Hispanic males in the Atlanta Metro area have generally higher incidence rates of CRC relative to other areas in Georgia. Region-specific awareness campaigns, with emphasis on reduction of risk factors and increases in screening, are recommended. In addition, increased access to PCPs and specialists for free or reduced-cost screening procedures would address disparities in rural areas in Georgia. Our study has a couple of limitations. This study considered investigating the trends of incidence rates from a southern state of Georgia. If we extend our study by adding other southern states, it might be also informative to understand the characteristics of incidence rates trend in southern region. In addition, this study didn’t consider mortality rates. A future study that considers both incidence and mortality rates by comparing southern area to remaining USA area might be another potential contribution. In methodology, the usage of join point regression method is able to upgrade the study by providing information on the number of estimates in join point year(s) and to estimate the year(s).
CONCLUSION
In the state of Georgia, CRC is a substantial public health problem. Efforts should be made to increase awareness about screening procedures and access to preventive care, particularly for black patients and patients in areas in Georgia outside the Atlanta metro area. In addition, efforts to reduce obesity, improve diet, and promote healthy lifestyles can help reduce CRC incidence rates in Georgia. Future study should investigate the concerning increasing incidence of CRC in Georgians and Americans <50 years of age.
Acknowledgments
This research was supported by and the National Institute on Minority Health and Health Disparities (U54MD008149), Atlanta Clinical & Translational Science Institute (2UL1TR000454), the National Cancer Institute (5R01CA166785 and 2U54 CA118638).
ABBREVIATIONS
- CRC
Colorectal Cancer
- US
United States
- FOBT
Fecal Occult Blood Testing
- IBD
Inflammatory Bowel Disease
- SEER
Surveillance, Epidemiology, and End Results
- ICD
International Classification of Diseases
References
- 1.Siegel RL, Miller KD, Jemal A. Cancer statistics, 2015. CA Cancer J Clin. 2015;65:5–29. doi: 10.3322/caac.21254. [DOI] [PubMed] [Google Scholar]
- 2.Edwards BK, Ward E, Kohler BA, Eheman C, Zauber AG, Anderson RN, et al. Annual report to the nation on the status of cancer, 1975–2006, featuring colorectal cancer trends and impact of interventions (risk factors, screening, and treatment) to reduce future rates. Cancer. 2010;116:544–573. doi: 10.1002/cncr.24760. [DOI] [PMC free article] [PubMed] [Google Scholar]
- 3.Chan AT, Giovannucci EL. Primary prevention of colorectal cancer. Gastroenterology. 2010;138:2029–2043. doi: 10.1053/j.gastro.2010.01.057. [DOI] [PMC free article] [PubMed] [Google Scholar]
- 4.Society AC. Colorectal Cancer Facts and Figures 2014–2016. 2014. [Google Scholar]
- 5.Yoo W, Coughlin SS, Lillard JW. Trends in cancer incidence rates in Georgia, 1982–2011. J Ga Public Health Assoc. 2015;5:96–100. [PMC free article] [PubMed] [Google Scholar]
- 6.Welton M, Robb SW, Shen Y, Guillebeau P, Vena J. Prostate cancer incidence and agriculture practices in Georgia, 2000–2010. Int J Occup Environ Health. 2015;21:251–257. doi: 10.1179/2049396714Y.0000000106. [DOI] [PMC free article] [PubMed] [Google Scholar]
- 7.U.S. Census Bureau PD, editor. Annual Estimates of the Resident Population by Sex, Race, and Hispanic Origin for the United States, States, and Counties: April, 2010 to July, 2014. 2015. [Google Scholar]
- 8.Surveillance E, and End Results (SEER) Program SEER*Stat Database: Incidence - SEER 18 Regs Research Data + Hurricane Katrina Impacted Louisiana Cases, Nov 2014 Sub (2000–2012) - Linked To County Attributes - Total U.S., 1969–2013 Counties, National Cancer Institute, DCCPS, Surveillance Research Program, Surveillance Systems Branch. 2014.
- 9.Anderson RN, Rosenberg HM. Age standardization of death rates: implementation of the year 2000 standard. Natl Vital Stat Rep. 1998;47:1–16. 20. [PubMed] [Google Scholar]
- 10.Klein RJ, Schoenborn CA. Age adjustment using the 2000 projected U.S. population. Healthy People 2010 Stat Notes. 2001:1–10. [PubMed] [Google Scholar]
- 11.Surveillance Research Program NCI: SEER*Stat software version 8.2.1.
- 12.Burt RW, Barthel JS, Dunn KB, David DS, Drelichman E, Ford JM, et al. NCCN clinical practice guidelines in oncology. Colorectal cancer screening. J Natl Compr Canc Netw. 2010;8:8–61. doi: 10.6004/jnccn.2010.0003. [DOI] [PubMed] [Google Scholar]
- 13.Molodecky NA, Soon IS, Rabi DM, Ghali WA, Ferris M, Chernoff G, et al. Increasing incidence and prevalence of the inflammatory bowel diseases with time, based on systematic review. Gastroenterology. 2012;142:46–54. doi: 10.1053/j.gastro.2011.10.001. [DOI] [PubMed] [Google Scholar]
- 14.Loftus EVJ, Shivashankar R, Tremaine WJ, Harmsen WS, Zinsmeiseter AR. Updated Incidence and Prevalence of Crohn’s Disease and Ulcerative Colitis in Olmsted County, Minnesota (1970–2011) ACG 2014 Annual Scientific Meeting. 2014 [Google Scholar]
- 15.The State of Obesity 2014. Washington, D.C: 2014. A project of the Trust for America’s Health and the Robert Wood Johnson Foundation. [Google Scholar]
- 16.Flegal KM, Carroll MD, Kit BK, Ogden CL. Prevalence of obesity and trends in the distribution of body mass index among US adults, 1999–2010. JAMA. 2012;307:491–497. doi: 10.1001/jama.2012.39. [DOI] [PubMed] [Google Scholar]
- 17.Renehan AG, Tyson M, Egger M, Heller RF, Zwahlen M. Body-mass index and incidence of cancer: a systematic review and meta-analysis of prospective observational studies. Lancet. 2008;371:569–578. doi: 10.1016/S0140-6736(08)60269-X. [DOI] [PubMed] [Google Scholar]
- 18.Naishadham D, Lansdorp-Vogelaar I, Siegel R, Cokkinides V, Jemal A. State disparities in colorectal cancer mortality patterns in the United States. Cancer Epidemiol Biomarkers Prev. 2011;20:1296–1302. doi: 10.1158/1055-9965.EPI-11-0250. [DOI] [PubMed] [Google Scholar]
- 19.Okabayashi K, Ashrafian H, Hasegawa H, Yoo JH, Patel VM, Harling L, et al. Body mass index category as a risk factor for colorectal adenomas: a systematic review and meta-analysis. Am J Gastroenterol. 2012;107:1175–1185. doi: 10.1038/ajg.2012.180. [DOI] [PubMed] [Google Scholar]
- 20.Yang Y, Buys DR, Judd SE, Gower BA, Locher JL. Favorite foods of older adults living in the Black Belt Region of the United States. Influences of ethnicity, gender, and education. Appetite. 2013;63:18–23. doi: 10.1016/j.appet.2012.12.007. [DOI] [PMC free article] [PubMed] [Google Scholar]
- 21.Wang Y, Beydoun MA, Caballero B, Gary TL, Lawrence R. Trends and correlates in meat consumption patterns in the US adult population. Public Health Nutr. 2010;13:1333–1345. doi: 10.1017/S1368980010000224. [DOI] [PMC free article] [PubMed] [Google Scholar]
- 22.Jones RM, Devers KJ, Kuzel AJ, Woolf SH. Patient-reported barriers to colorectal cancer screening: a mixed-methods analysis. Am J Prev Med. 2010;38:508–516. doi: 10.1016/j.amepre.2010.01.021. [DOI] [PMC free article] [PubMed] [Google Scholar]
- 23.Petterson SMCA, Moore M, Bazemore A. State-level projections of primary care workforce, 2010–2030. Robert Graham Center; 2013. [Google Scholar]


