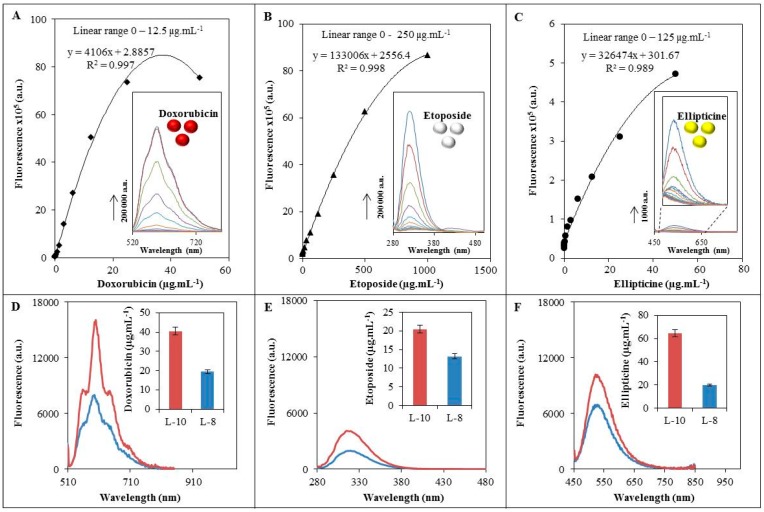
Figure 2.
Dependence of fluorescence signal on drug concentration. The corresponding fluorescence spectra are given in the insets. (A) Doxorubicin within the 0.05–50 µg·mL−1 concentration range; (B) etoposide within the 1–1000 µg·mL−1 concentration range and (C) ellipticine within the 0.05–50 µg·mL−1 concentration range. Fluorescence spectra of encapsulated drugs in cholesterol-free liposomes (red line) and liposomes with cholesterol (blue line): (D) doxorubicin; (E) etoposide; and (F) ellipticine. The calculated encapsulated concentration of drug in liposomes is given in the inserted graphs. Excitation wavelengths for doxorubicin, etoposide and ellipticine were 480, 250 and 420 nm, respectively.

