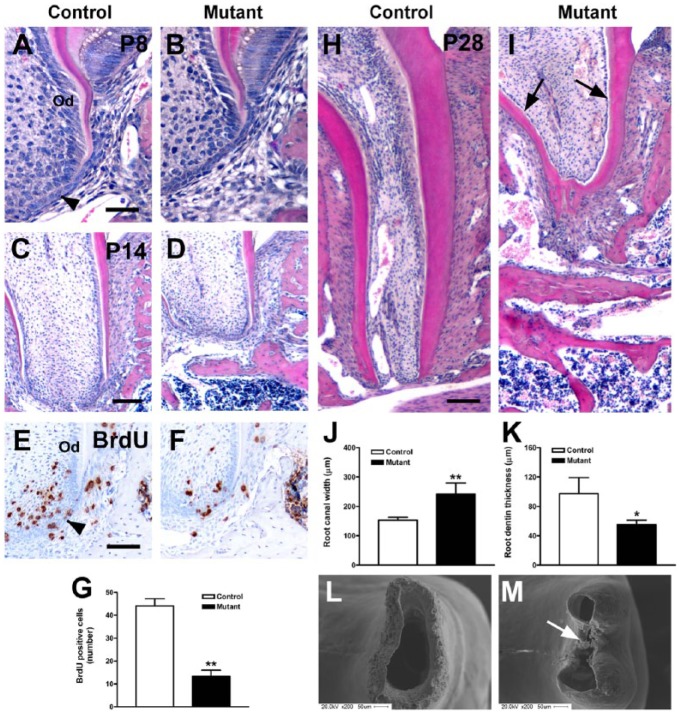
Figure 3.
Impaired root elongation in the mandibular first molar of OC-Cre;WlsCO/CO mice. (A–D, H–I) Hematoxylin and eosin–stained sections of the mandibular first molar in control and mutant mice at P8, P14, and P28. (E–G) In the developing root apex of controls at P14, BrdU-labeled proliferating cells were abundant. However, few cells were positively labeled with BrdU in mutant mice. (J–K) Root canal width and radicular dentin thickness in control and mutant mice at P28. (L–M) Basal view of distal root apex of the mandibular first molar at P28. *P < 0.05 and **P < 0.01. Black arrowhead indicates Hertwig’s epithelial root sheath. Od, odontoblasts. Scale bars: 40 µm (A, B), 80 µm (E, F), and 100 µm (C, D, G, H).

