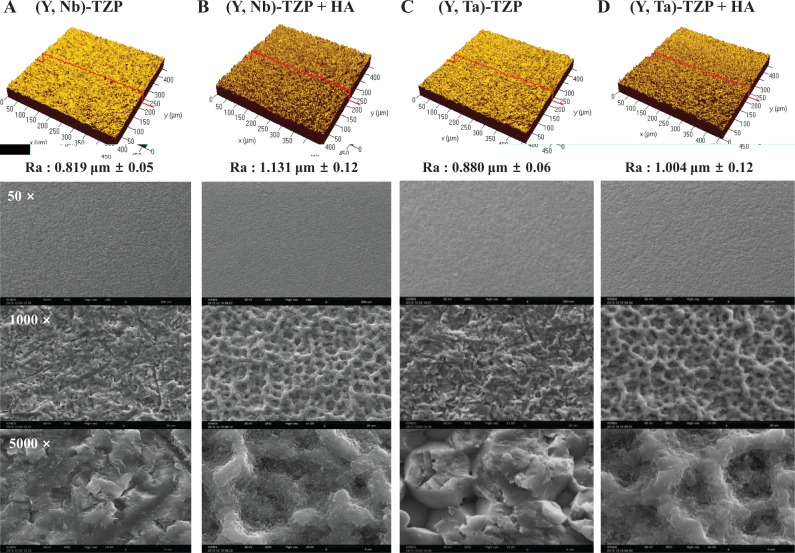
Figure 2.
Confocal laser scanning microscopy (CLSM) images showing the roughness (Ra) of the material surfaces (upper panel). (A) (Y, Nb)-TZP; (B) hydroxyapatite (HA)-coated (Y, Nb)-TZP; (C) (Y, Ta)-TZP; and (D) HA-coated (Y, Ta)-TZP. Scanning electron microscopy (SEM) images of material surfaces (A-D, bottom panel). Images are magnified 50×, 1,000×, and 5,000×.

