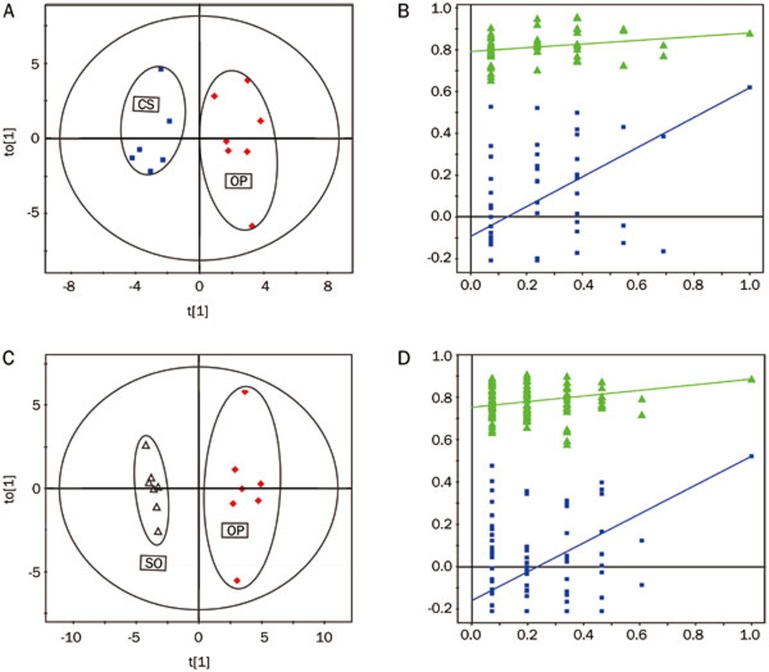
Figure 3.
The score plots (left) and the permutation tests (right) derived from OPLS-DA models of (A, C) CS vs OP with the 5-round cross validation, (B, D) OP vs SO with the 5-round cross validation of 1H NMR spectra of aqueous liver extracts. Variables of score plots are autoscaling all variables to unit variance.

