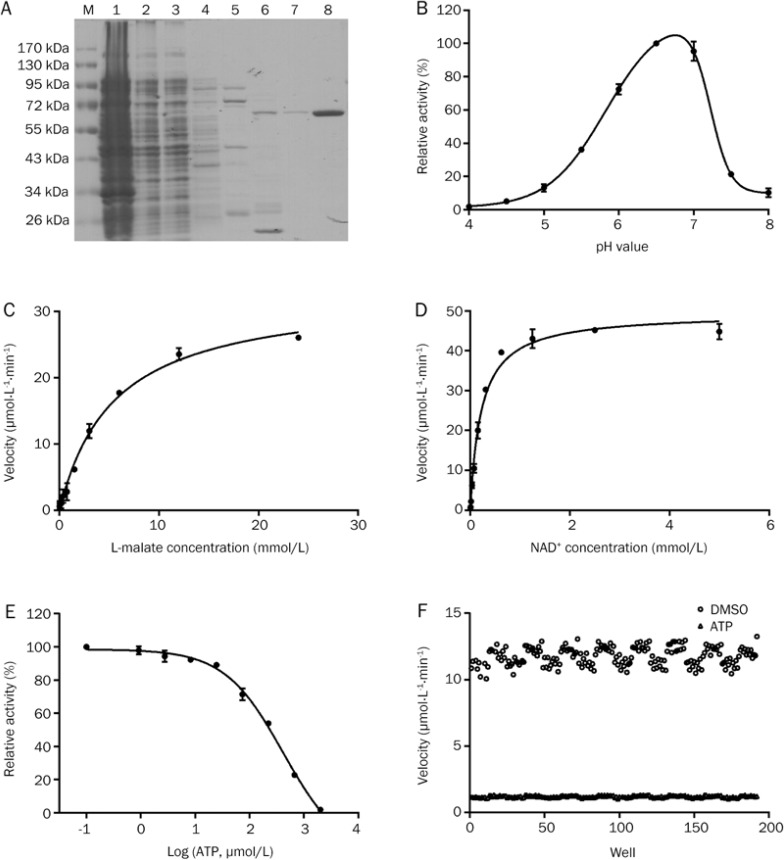
Figure 1.
Establishment of a high-throughput screening system to identify inhibitors of ME2. (A) SDS-PAGE analysis of purified ME2 separated using a 10% polyacrylamide gel and stained with Coomassie Brilliant Blue. M, protein marker. Lanes 1–8 are the precipitate, supernatant, flow-through, and elution fractions with 10, 50, 100, 250, and 250 mmol/L imidazole, respectively. (B) Optimization of the pH of the screening system. (C, D) Determination of Km and Kcat of L-malate (C) and NAD+ (D). (E) Dose-response curve of inhibition of ME2 by ATP. (F) Determination of the Z′ factor and S/N of the HTS system for ME2 inhibitors. Error bars represent SD. n=3.

