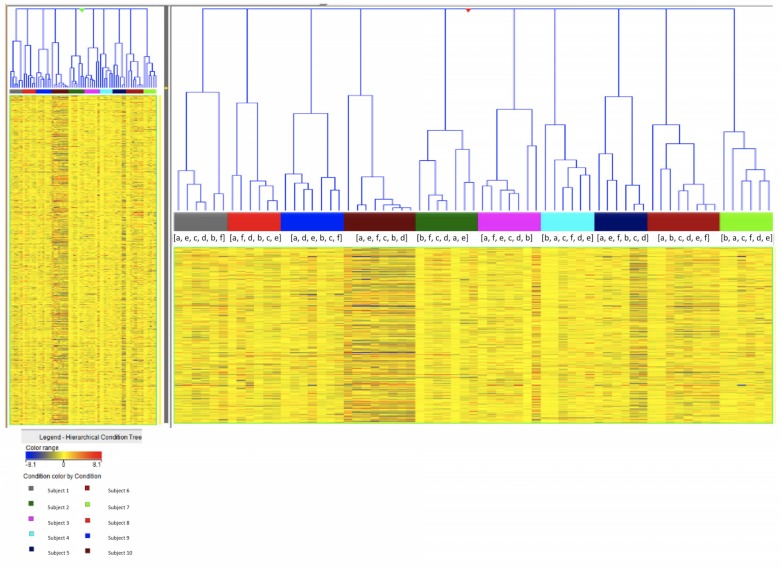
Fig 2. Hierarchical cluster analysis by condition tree clustering.
Each individual color corresponds to a data from a single astronaut. Data from 10 a total of astronauts are presented. Letters indicate sampling time point: (a) Preflight 1, (b) Preflight 2, (c) Inflight 1, (d) Inflight 2, (e) Postflight 1, (f) Postflight 2.

