
Fig 1. Linkage disequilibrium D’ (A) and R-Squared (B) plots estimated by using expectation-maximization algorithm in Haploview V4.2.
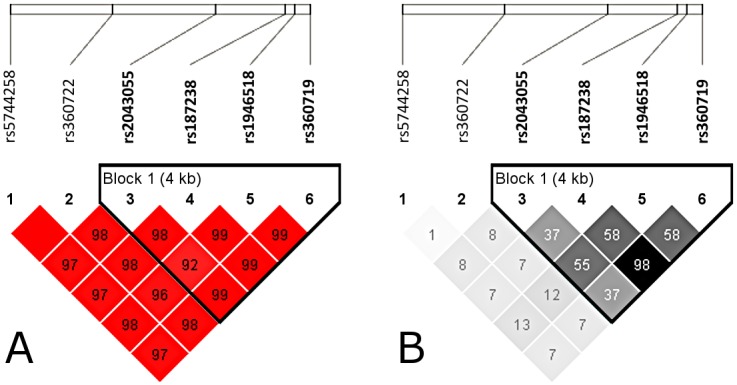
The analysis revealed that IL18 genetic variants were in strong LD.
Official websites use .gov
A
.gov website belongs to an official
government organization in the United States.
Secure .gov websites use HTTPS
A lock (
) or https:// means you've safely
connected to the .gov website. Share sensitive
information only on official, secure websites.
The analysis revealed that IL18 genetic variants were in strong LD.