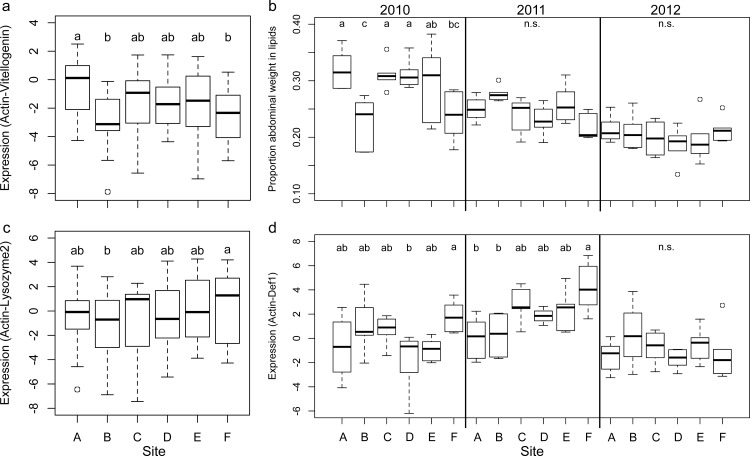
Fig 6. Measures of statistically modeled nutritional status and immune gene expression in individual 7-day old bees collected from colonies in September each year.
Measures of nutrition included gene expression levels of vitellogenin (a) and weight of abdominal lipids (b). Measures of immune functioning included gene expression levels of lysozyme2 (c), and defenisin1 (d). (See S5 and S6 Figs for other related measures). Vitellogenin, defensin1, and lysozyme2 expression were determined from the same bees (n = 47 per site), while abdominal lipids were quantified from separate bees (n = 180 per site). Box and whisker plots depict the median (black line), upper and lower 25% quartiles (the box), maximum and minimum (whiskers) not including outliers, and outliers (open circles) that were greater or less than 1.5 times the upper or lower quartile, respectively.

