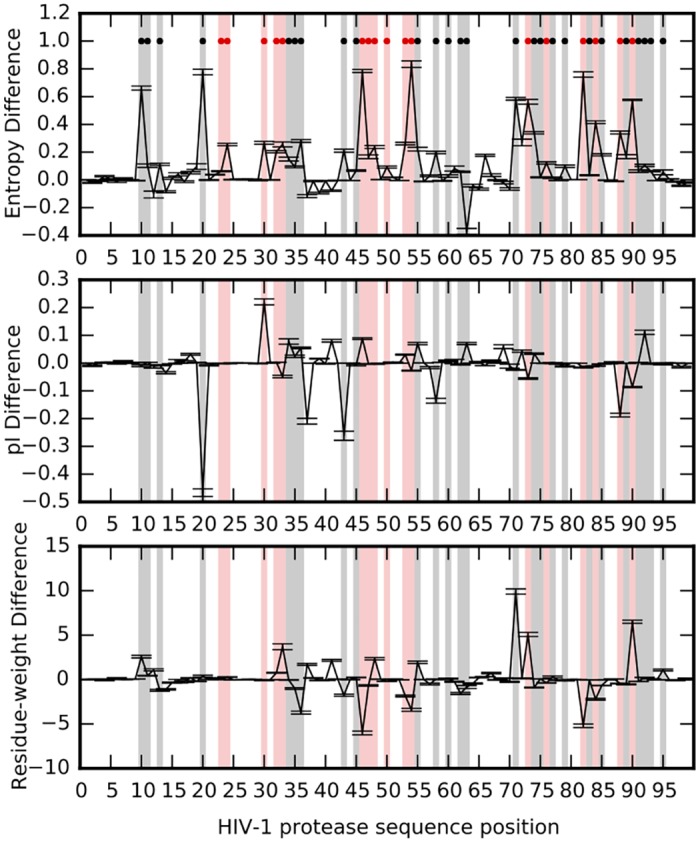
Fig 2. Changes in protease entropy and physico-chemical properties.

Changes in per-site entropies (top panel), residue isoelectric point (middle panel), and residue weights (bottom panel) due to treatment. The property difference at each site is obtained by subtracting property (entropy/pI/residue-weight) value of the untreated data from that of the treated data. Average values are obtained by sampling sequence data from all years (1998–2006, 10 subsamples/year of 300 sequences each). Error bars represent ±1 SE. Red dots represent positions known to be primary drug resistance loci, while black dots mark positions of compensatory or accessory mutations [52]. Resistance loci are shaded in red and accessory loci are shaded in black.
