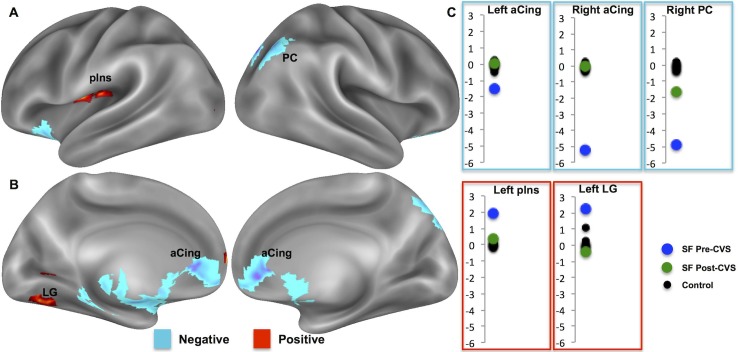
Fig 2. Functional connectivity of the left thalamus.
(A–B) Comparison between the functional connectivity of the left thalamus between SF and a control group prior to CVS. Blue blobs = abnormally negative functional connectivity; Red blobs = abnormally positive connectivity. (C) Functional connectivity values (upper panel = negative and lower panel = positive) of the control group (black dots) and the patient (blue dot = Pre–CVS and green dot = Post–CVS). aCing = anterior cingulum; LG = lingual gyrus; PC = parietal cortex; pIns = posterior insula.

