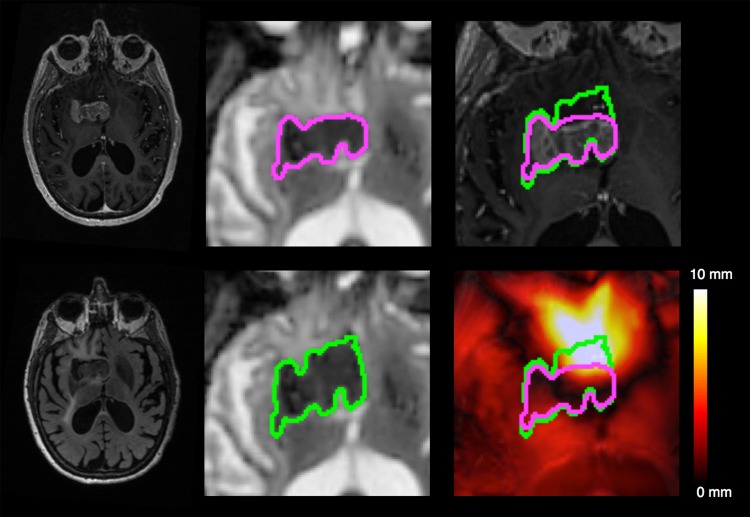
Fig 4. Illustrative example of a tumor’s displacement with and without correcting for EPI distortions.
Top left, T1-weighted image with contrast. Bottom left, Fluid Attenuated Inversion Recovery image. Middle: ADC calculated from corrected diffusion image (top) and uncorrected diffusion image (bottom) with the regions of diffusion restriction outlined (green/purple). Top right, corrected (purple) and uncorrected diffusion restriction outline (green) overlaid on T1-weighted image with contrast. Bottom right, corrected and uncorrected diffusion restriction outline overlaid on the displacement map.

