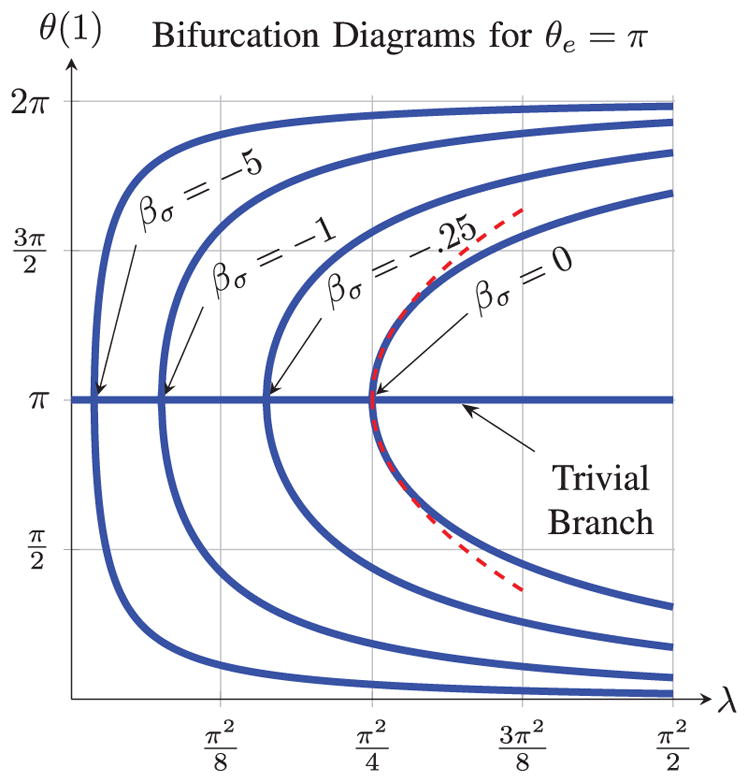
Fig. 3.

Bifurcation diagrams are shown for various transmission lengths. As the transmission length grows, the bifurcation points, indicated by the arrowheads, are pushed closer to λ = 0. The red dashed line shows equation (11), which describes the behavior near the bifurcation point λ0 = π2/4.
